Uncover trends for crucial digital KPIs
Access the 2024 Digital Experience Benchmarks Report and Interactive Explorer.

When working to resolve website performance issues for our customers, this famous quote from Top Gun often comes to mind.
“I feel the need, the need for speed!” —Peter “Maverick” Mitchell, Top Gun
Today’s customers want instant gratification and access to information. As digital consumers, we’ve undoubtedly faced the frustrations of slow loading sites; pictures and fancy fonts that take too long, videos that buffer, and poor response times to user actions. Research has shown that a delay of 1 second in page load speed leads to a 16% decrease in customer satisfaction and fewer page views.
“First impressions matter as much online as in person, so when a website fails to impress, customers will bounce off quicker than they got there.” — Sam Counterman, Vice President of Brand & Growth Marketing at Contentsquare
In a digital economy, we have become inherently impatient. This often means that online user experiences matter more than brand loyalty and trickle down to customer conversions and retention. To use a personal example, I was a loyal customer of a particular airline for many years; however, their dreadful website experience recently left me so fed up that I don’t fly with them anymore!
Beyond good design and site navigation for seamless user experiences, website loading speed is a crucial element often neglected. Loading speed also matters to search engine ranking as Google considers a site’s user-friendliness. Relevant sites that launch faster, avoid dynamic elements while loading and allow users to interact faster will be placed higher on a Google search.
According to Google, the probability of bounce rate increases by 32% between the first 1 to 3 seconds, which means brands don’t have much time to meet or exceed visitor expectations.
As website performance becomes a vital marker against business goals, organizations require specific data to measure a site’s user-friendliness. Google’s Core Web Vitals (CWVs) are three important metrics to measure a brand’s digital success, comprised of:
Optimal site performance relies on getting all three elements right to decrease bounce rates, boost visitor retention, increase conversion and optimize the site for search engine discovery. Once you’ve uncovered your CWVs, it’s pretty amazing to discover how small changes, such as converting image formats from PNG to SVG, can vastly improve site performance and loading speeds.
Uncover trends for crucial digital KPIs Access the 2024 Digital Experience Benchmarks Report and Interactive Explorer.
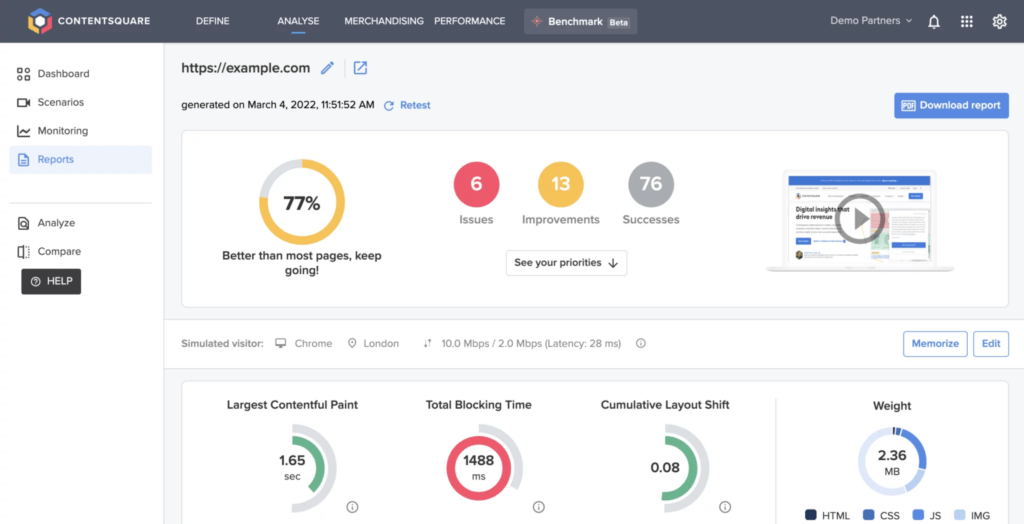
At Contentsquare, we’re committed to building better digital experiences for everybody. Certainly, for my team, we work hard to help brands consistently monitor and improve their performance against CWVs with our proprietary Speed Analysis tool. This allows you to monitor the loading of your pages from different mobile terminals and network qualities. It also analyzes site performance by comparing two or more site versions to determine the better option.

An example of Contentsquare’s Speed Analysis interface.
As you set out to improve your CWVs, it’s important to remember that it’s a marathon, not a sprint. On that note, here are some of our top tips for improving the three CWVs elements.
Sites should ideally aim for an LCP score of 2.5 seconds or less. In one real-life example of site analysis using our Customer Journey Analytics tool, we found the bounce rate for poor LCP was 32.9% compared to 18.6% for a site with good LCP. Some ways to fix this issue include:
Sites should aim for an FID score of 100 milliseconds or less by:
Sites should aim for a CLS score of 0.1 or less. Here are some remedies:
Fast 100: The UK’s Best Performing Websites Get the Fast 100 report to see how leading UK brands rank according to site performance.
Measuring our site’s performance and speed is a top business priority, particularly when we want to replicate best practices for Contentsquare customers. And suffice to say, we really do practice what we preach…
In 2022, Contentsquare rebranded and revamped our website, analyzing CWV using our analytical tools. We realized our new site was slow and didn’t pass CWVs scores on most pages. This was impacting our bounce rate and conversions. To address these website issues, we adopted a three-step process:
Previously, for me to come up with this data and end up with a roadmap, I’d have had to use several tools to draw conclusions. Access to this data as a one-stop shop within Contentsquare is hugely beneficial for speed and efficiency.
Ensure your website is set up for success to win new customers and retain loyalty. Get started by checking out our 2022 Digital Experience Benchmark report to give you a baseline. You can also experience our Speed Analysis tool for yourself and your team by booking a demo with our experts today.