How to improve your website performance
55+ tips to optimize your web performance for improved digital experiences and business growth.

Today’s consumer is impatient. In fact, online shoppers list slow page load times as the second most frustrating part of online shopping. So, if your site takes too long to load or if the page layout is unstable, it’s likely your visitors will get frustrated and go elsewhere.
But it’s not just your website visitors who demand seamless experiences. The loading speed of your site is a crucial parameter for search engine ranking, too. Google will penalize you if your website performance isn’t up to par.
So, how can you optimize your web performance? Why is it important? And how can you measure it? Check out our answers below 👇
Website performance measures the responsiveness of your website and how quickly it loads, offering up insights to help you optimize your site to ensure it’s as fast and user-friendly as possible.
Web Performance Optimization (WPO) is the practice of improving the performance of your website through different techniques, such as image optimization, avoiding 301 redirects, implementing a CDN, and browser and server caching.
Web performance is a direct indicator of the health of your website. The load speed of your website is the first thing a user sees when they arrive at your site.
You can compare this entry point to a physical clothing store door—if your store’s doors weigh several tons and customers can’t open the door, they’re likely to go somewhere else. The easier it is for customers to enter your site, the more likely your customers are to stay. The same goes for your website.
Website performance optimization has a massive impact on your customer experience and digital customer journey. A high-performing website will help you:
How to improve your website performance 55+ tips to optimize your web performance for improved digital experiences and business growth.
Although website performance can get rather technical, measuring your website’s performance isn’t just based on your website’s load speed alone. There’s a handful of criteria to take into account such as:
These questions allow you to evaluate your site experience and with each optimization, no matter how small, the performance of your site will improve. You can even start to see results in a short period of time!
Scroll down to learn more about which tools to use to monitor and measure your website performance 👇
We can’t talk about website performance without mentioning Core web vitals.
Google’s most recent algorithm update measures page experience using multiple search signals, one of them being Core Web Vitals. It takes into account the load speed of a website, but it also includes other factors that relate to the overall usability of your website.
Core Web Vitals measure site performance based on three evaluation criteria:

The Core Web Vitals Rating Scale – Source: Google
To understand how your website’s performing, you can run your URL through a site speed testing tool. There are plenty of free tools out there, like Google’s Page Speed Insights.
Free tools are for an initial overview, but if you want more in-depth insights more advanced solutions are the way to go. Take Contentsquare’s Speed Analysis, for example, it allows users to monitor and improve your web performance continuously.
Advanced tools can help you better analyze your site over time and alert you immediately in case of any issues. Here’s how the two tools differ:
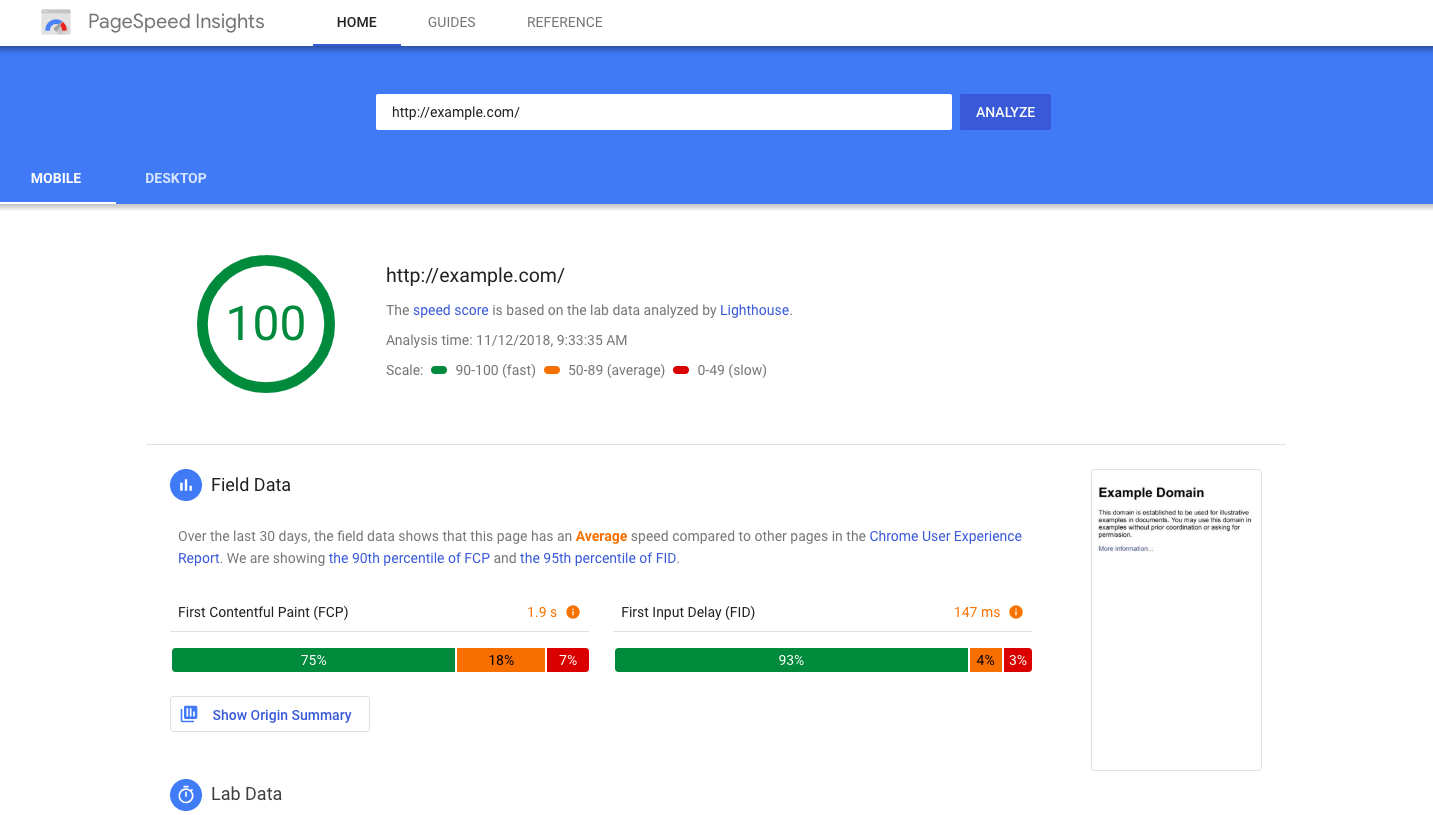
Google’s Page Speed Insights is arguably the most used website speed analysis tool. It gives a good snapshot of your Web Core Vitals and the performance of your site through one single test. It provides results for both mobile and desktop sites, as well as helpful tips on how to make improvements.
The tool shows an overall score that summarizes the page’s simulated performance. A score of 90 or above is considered good, any score between 50 to 90 needs improvement, and below 50 is considered poor.

Google’s PageSpeed Insights Source: Google
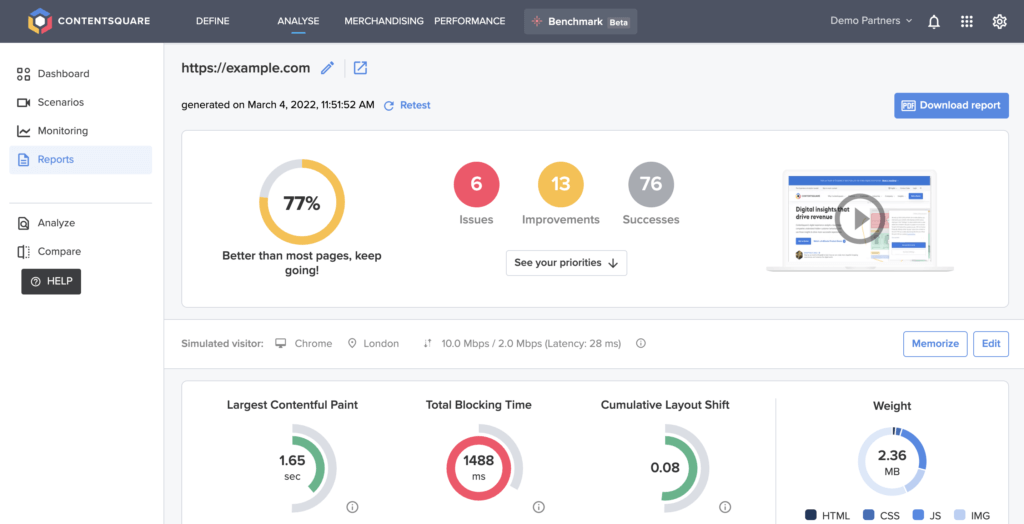
Contentsquare’s Speed Analysis (formerly known as Dareboost) allows you to continuously monitor and optimize your web pages. Real-time notifications alert users of any quality or loading time issues impacting the site performance. It allows you to analyze site performance by comparing between two or more site versions to see which is the best option.

Example of results from Contentsquare’s Speed Analysis tool
Speed Analysis helps users view metrics such as loading time, render time, and first-byte time. It also helps review things like connection speed, connection locations, web or mobile access, new visit vs. revisit, GDPR consent clicked or not, etc. to give you more visibility.
The tool can follow complete navigation scenarios, to ensure that the user experience is optimal from start to finish. And it doesn’t just provide simple explanations of each issue but also gives clear recommendations on how to improve your website performance.
There’s a boatload of other website performance testing and monitoring tools that exist on the market. Here are a few to look out for:
Find out how Contentsquare’s digital experience analytics platform equipped with Speed Analysis can help you understand and optimize your website performance by taking our product tour. Find out how you can troubleshoot bugs and performance issues faster than ever before!

Take a product tour
Get to grips with Contentsquare fundamentals with this 6 minute product tour.
You can check the performance of a website using website performance and speed testing tools like Google Page Insights or more in-depth monitoring tools such as Contentsquare’s Speed Analysis.
There are several performance indicators of a website such as the bounce rate, the number of page views, the time spent on your website, the traffic sources, the number of visits from search engines. Core Web Vitals and Google’s Page Experience update take into account other criteria such as LCP, FID, and CLS.
Core Web Vitals measure loading time, interactivity, and visual stability via the following three signals: Largest Contentful Paint (LCP) for page load speed, The First Input Delay (FID) for page responsiveness, Cumulative Layout Shift (CLS) for visual stability and how often users experience unexpected layout changes.