Discover the power of Error Analysis

![]() Error Analysis
Error Analysis
Fix the errors that hurt the worst
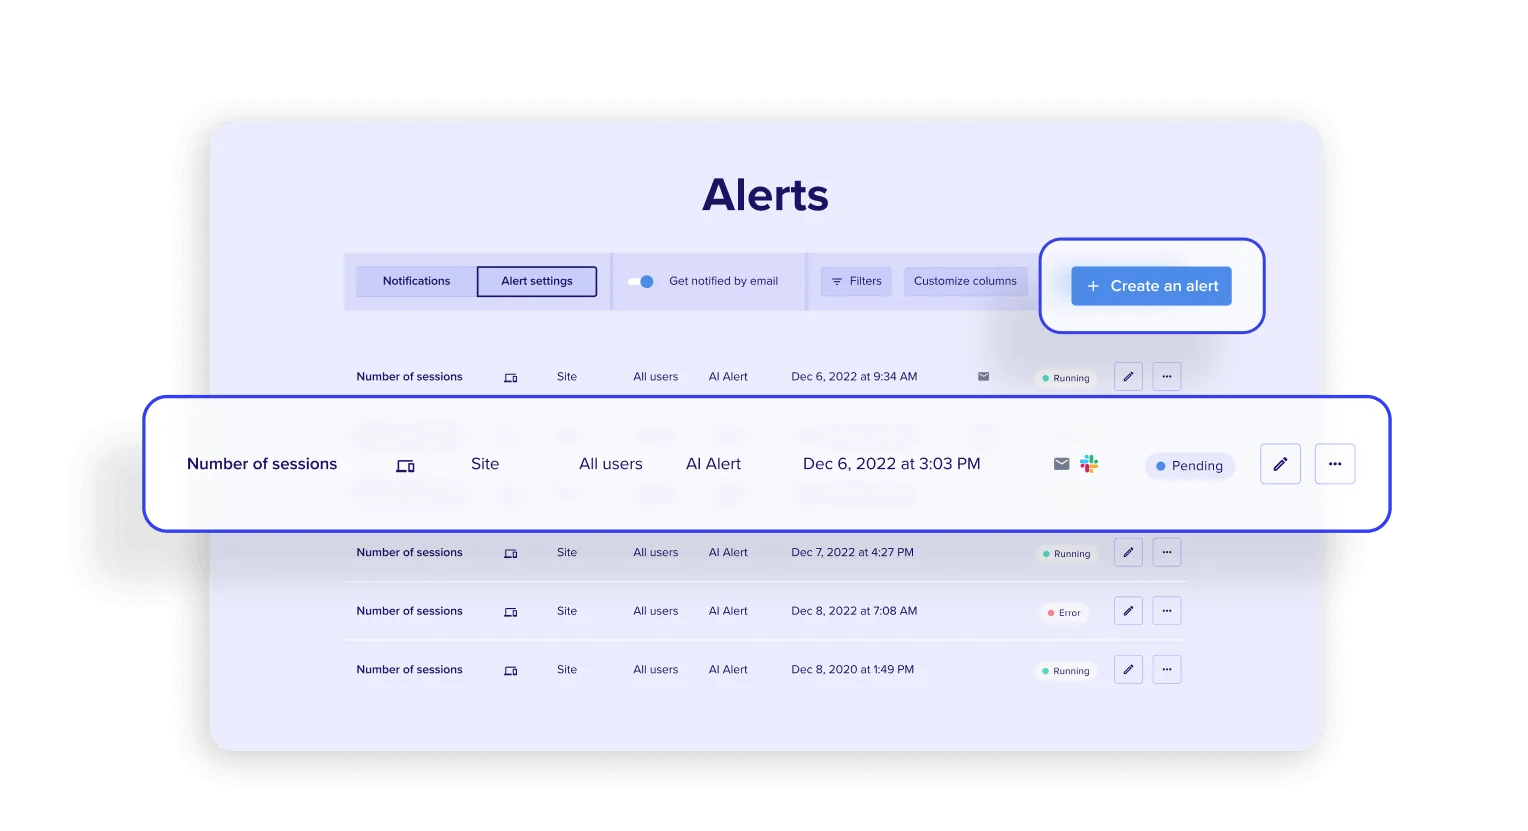
Surface technical issues on your sites and apps, rank them by impact, and quickly dig deeper to understand the context and get the detail needed to solve them. Get alerted in real-time to fix problems fast.
Key Features
Surface and resolve technical and functional errors
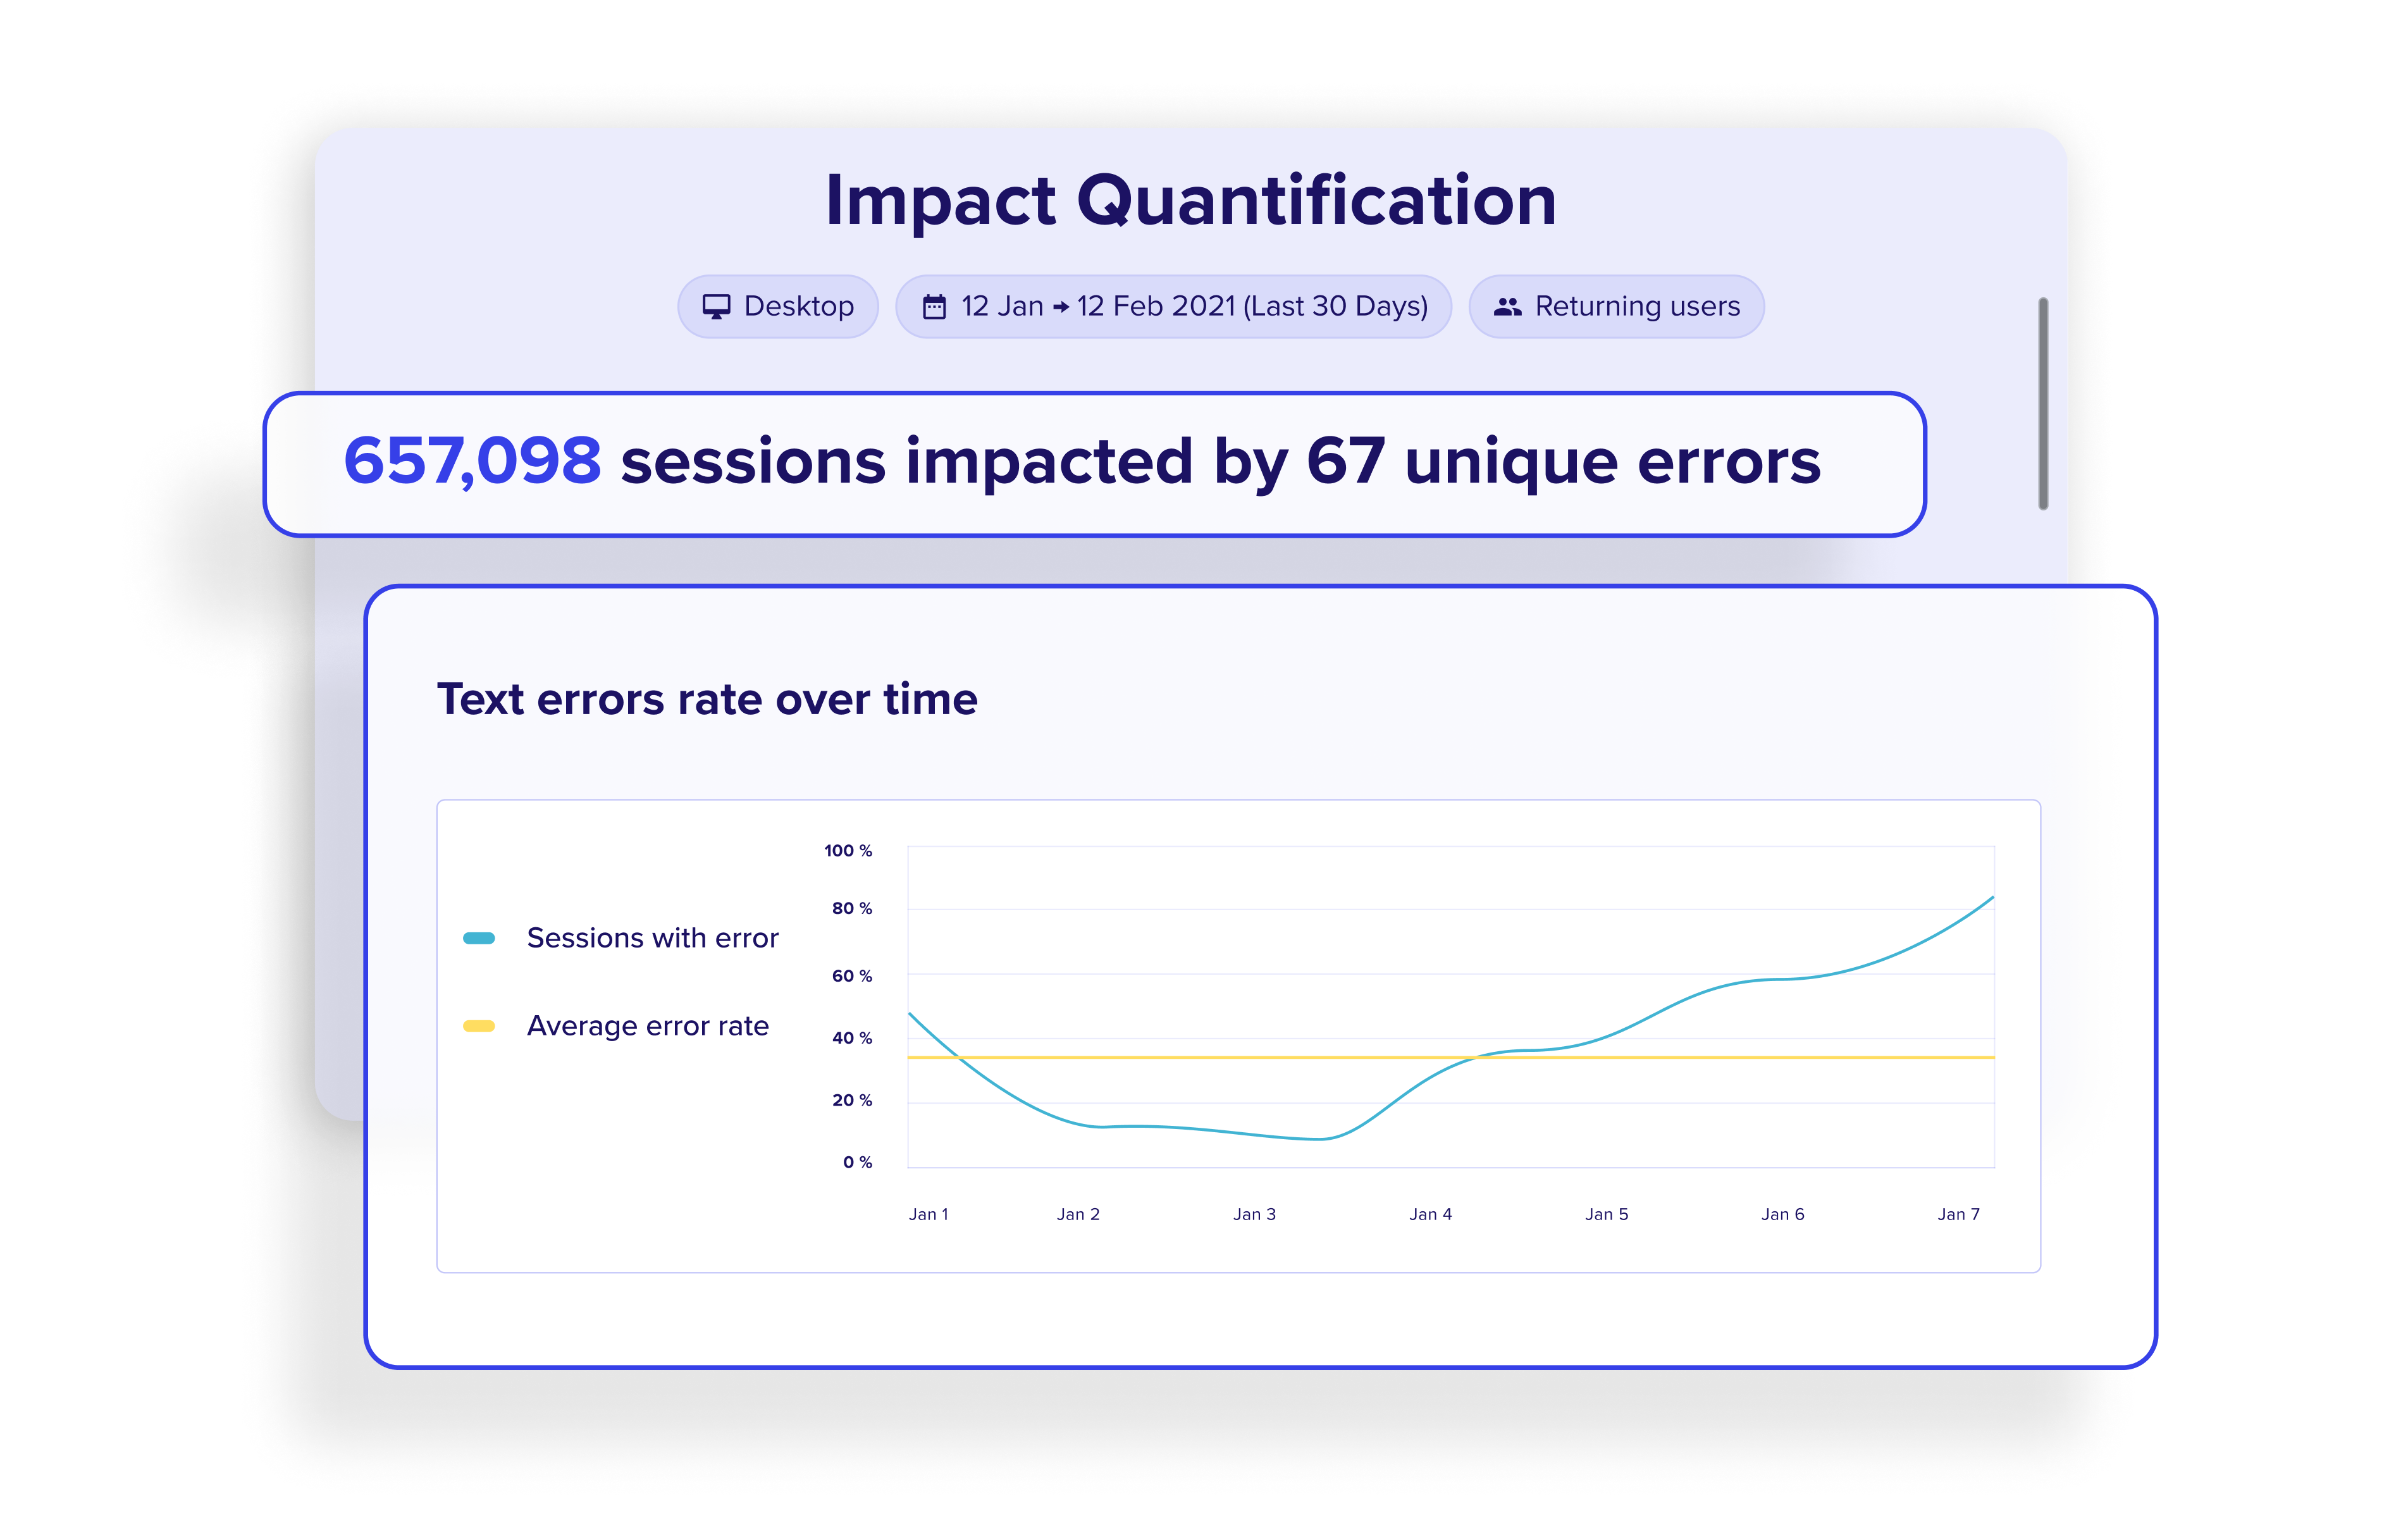
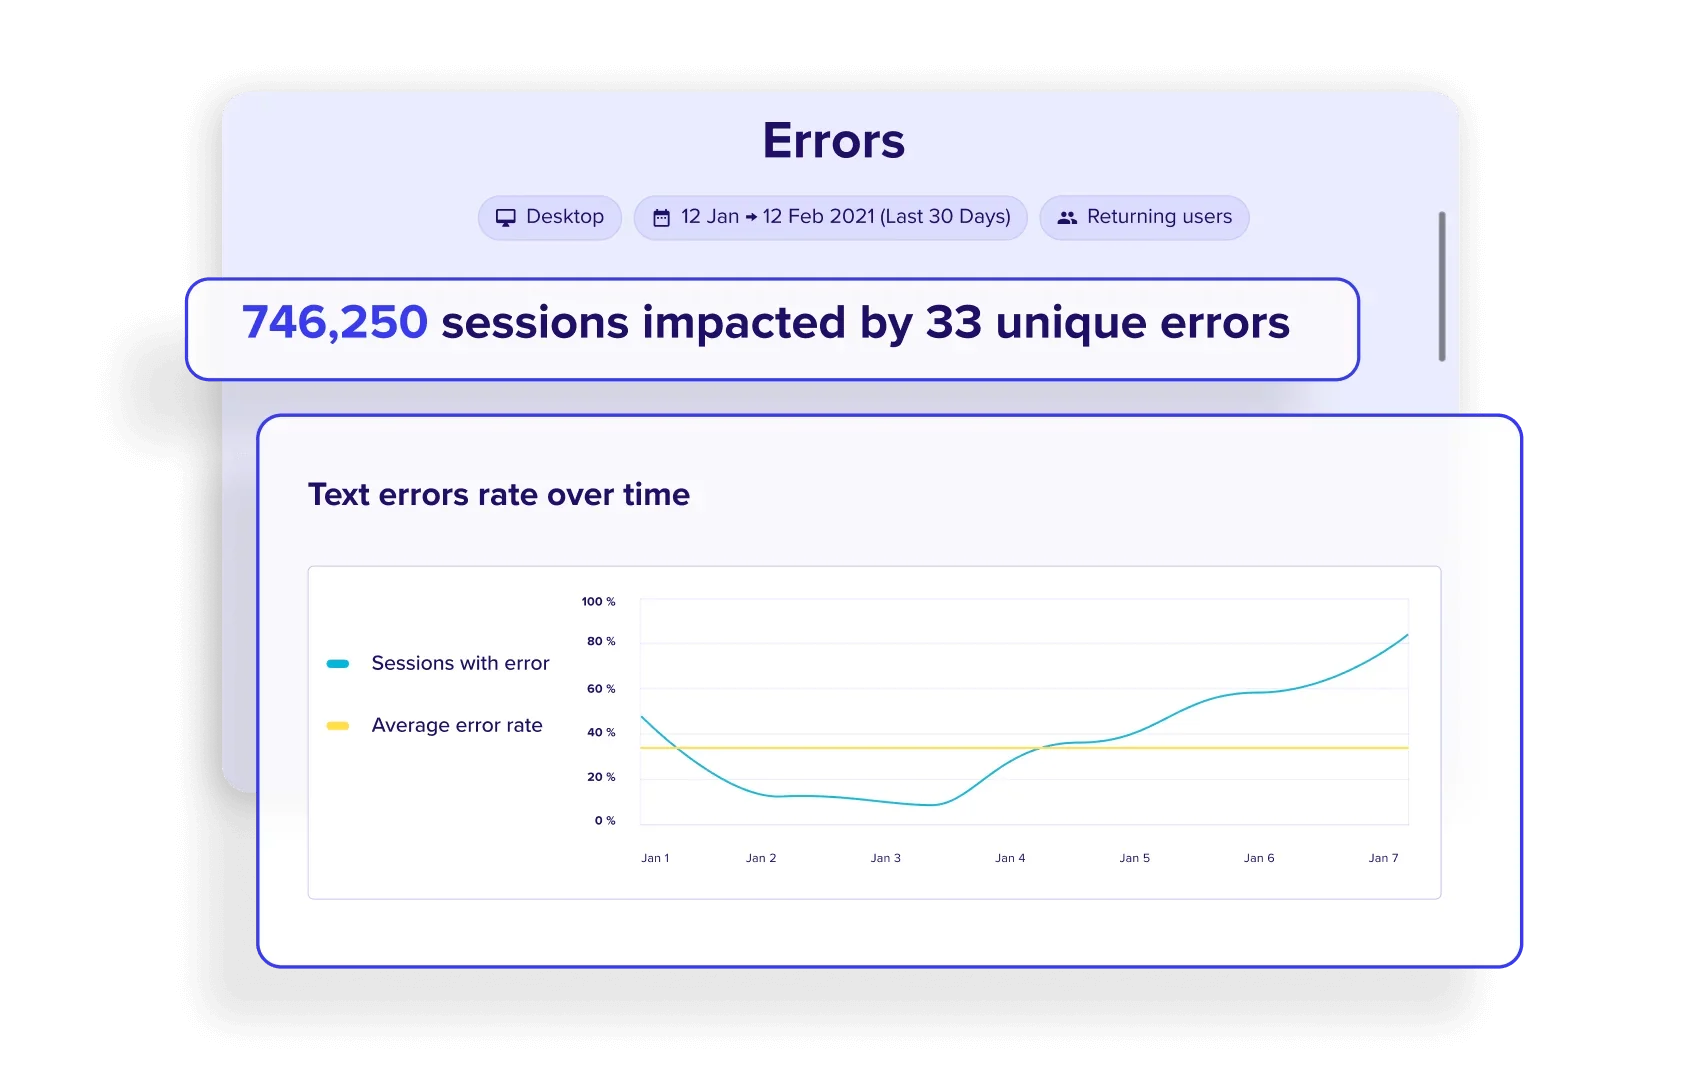
Proactively find and prioritize JavaScript, API, and custom errors harming conversions and revenue.
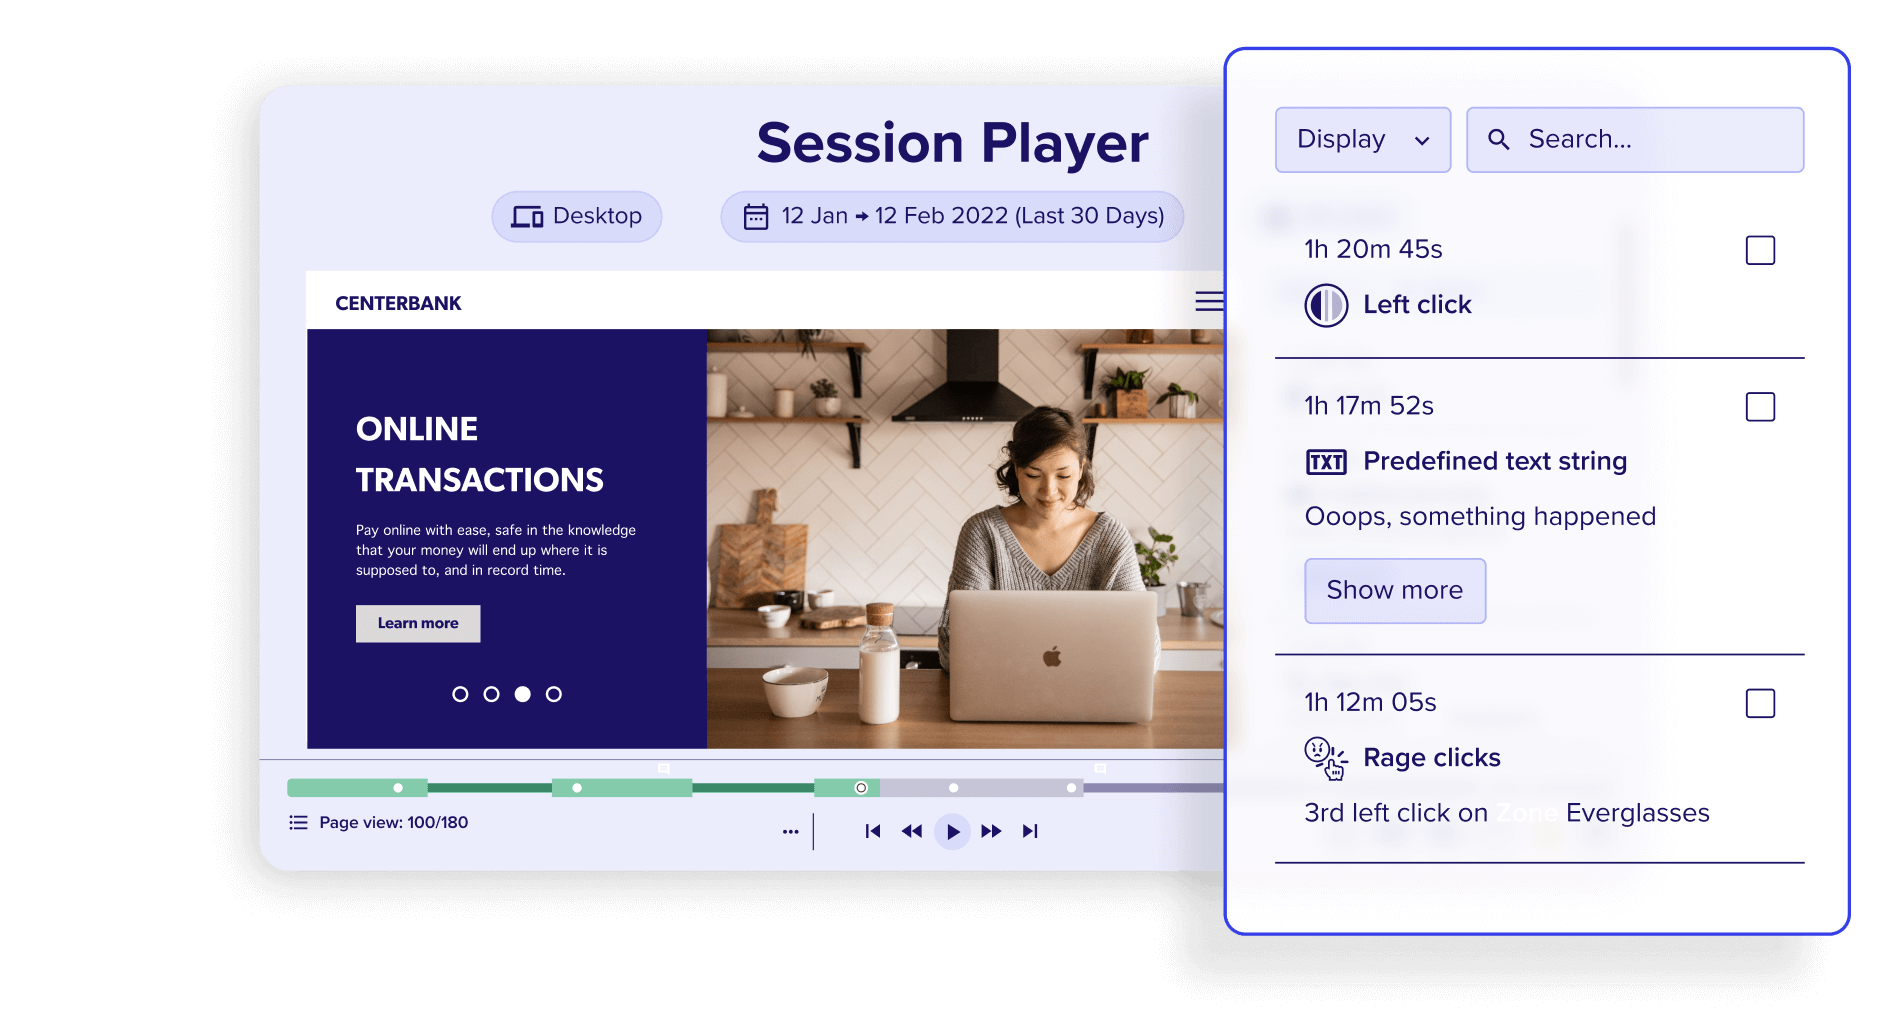
Reproduce the errors with session replay to understand the context and get to the root cause.
Distinguish signal from noise with statistical significance calculations and deterministic error groupings so you can focus on what matters. Enable engineers to drill down to the most granular technical view of the request & response data to help them fix issues faster.
Most common use cases
Surface the worst errors that hurt your business top-down
No team has time to monitor every journey or customer. Contentsquare automatically surfaces the most critical errors to prioritize.

Build higher quality products faster by finding and fixing errors faster.
Deliver more and higher quality releases with your team by more easily debugging and troubleshooting new experiences as you launch them.

Triage and troubleshoot user complaints by surfacing root causes in session replays
When replaying sessions leading up to feedback via voice-of-customer or contact center tickets, let the session replay event stream pinpoint where technical errors are happening and what the root cause is. With a few clicks, quantify how many other users are seeing the same errors.
The North Face X Contentsquare
Leveraging CX to optimize holiday shopping
Every year in October, The North Face launches an online Gift Guide to help shoppers navigate the gift-giving season. As the main retail event of the year, the lead-up to the holidays is a major source of digital revenue for the brand, and getting it wrong is simply not an option.
Read more from The North face View all case studies
"
What’s great about Contentsquare is that the insights are visual and extremely easy to digest. It’s particularly helpful to be able to give the creative or leadership team a clear picture of pain points and successes — it helps secure immediate buy-in and significantly reduces time to action, meaning we don’t miss out on potential sales."
Lisa Skowrup
Senior Manager, Site Experience
The North Face
-
![]()
Blog
How to Check for Website Errors and Why It’s Essential for Your Business
Dive into how website errors can affect your business and then into how to spot and fix those errors.
-
![]()
eBook
How to improve your website performance
In this guide, we cover the key metrics (CWV and otherwise) that you need to be tracking and present 55+ actionable insights to optimize your web performance.
-
![]()
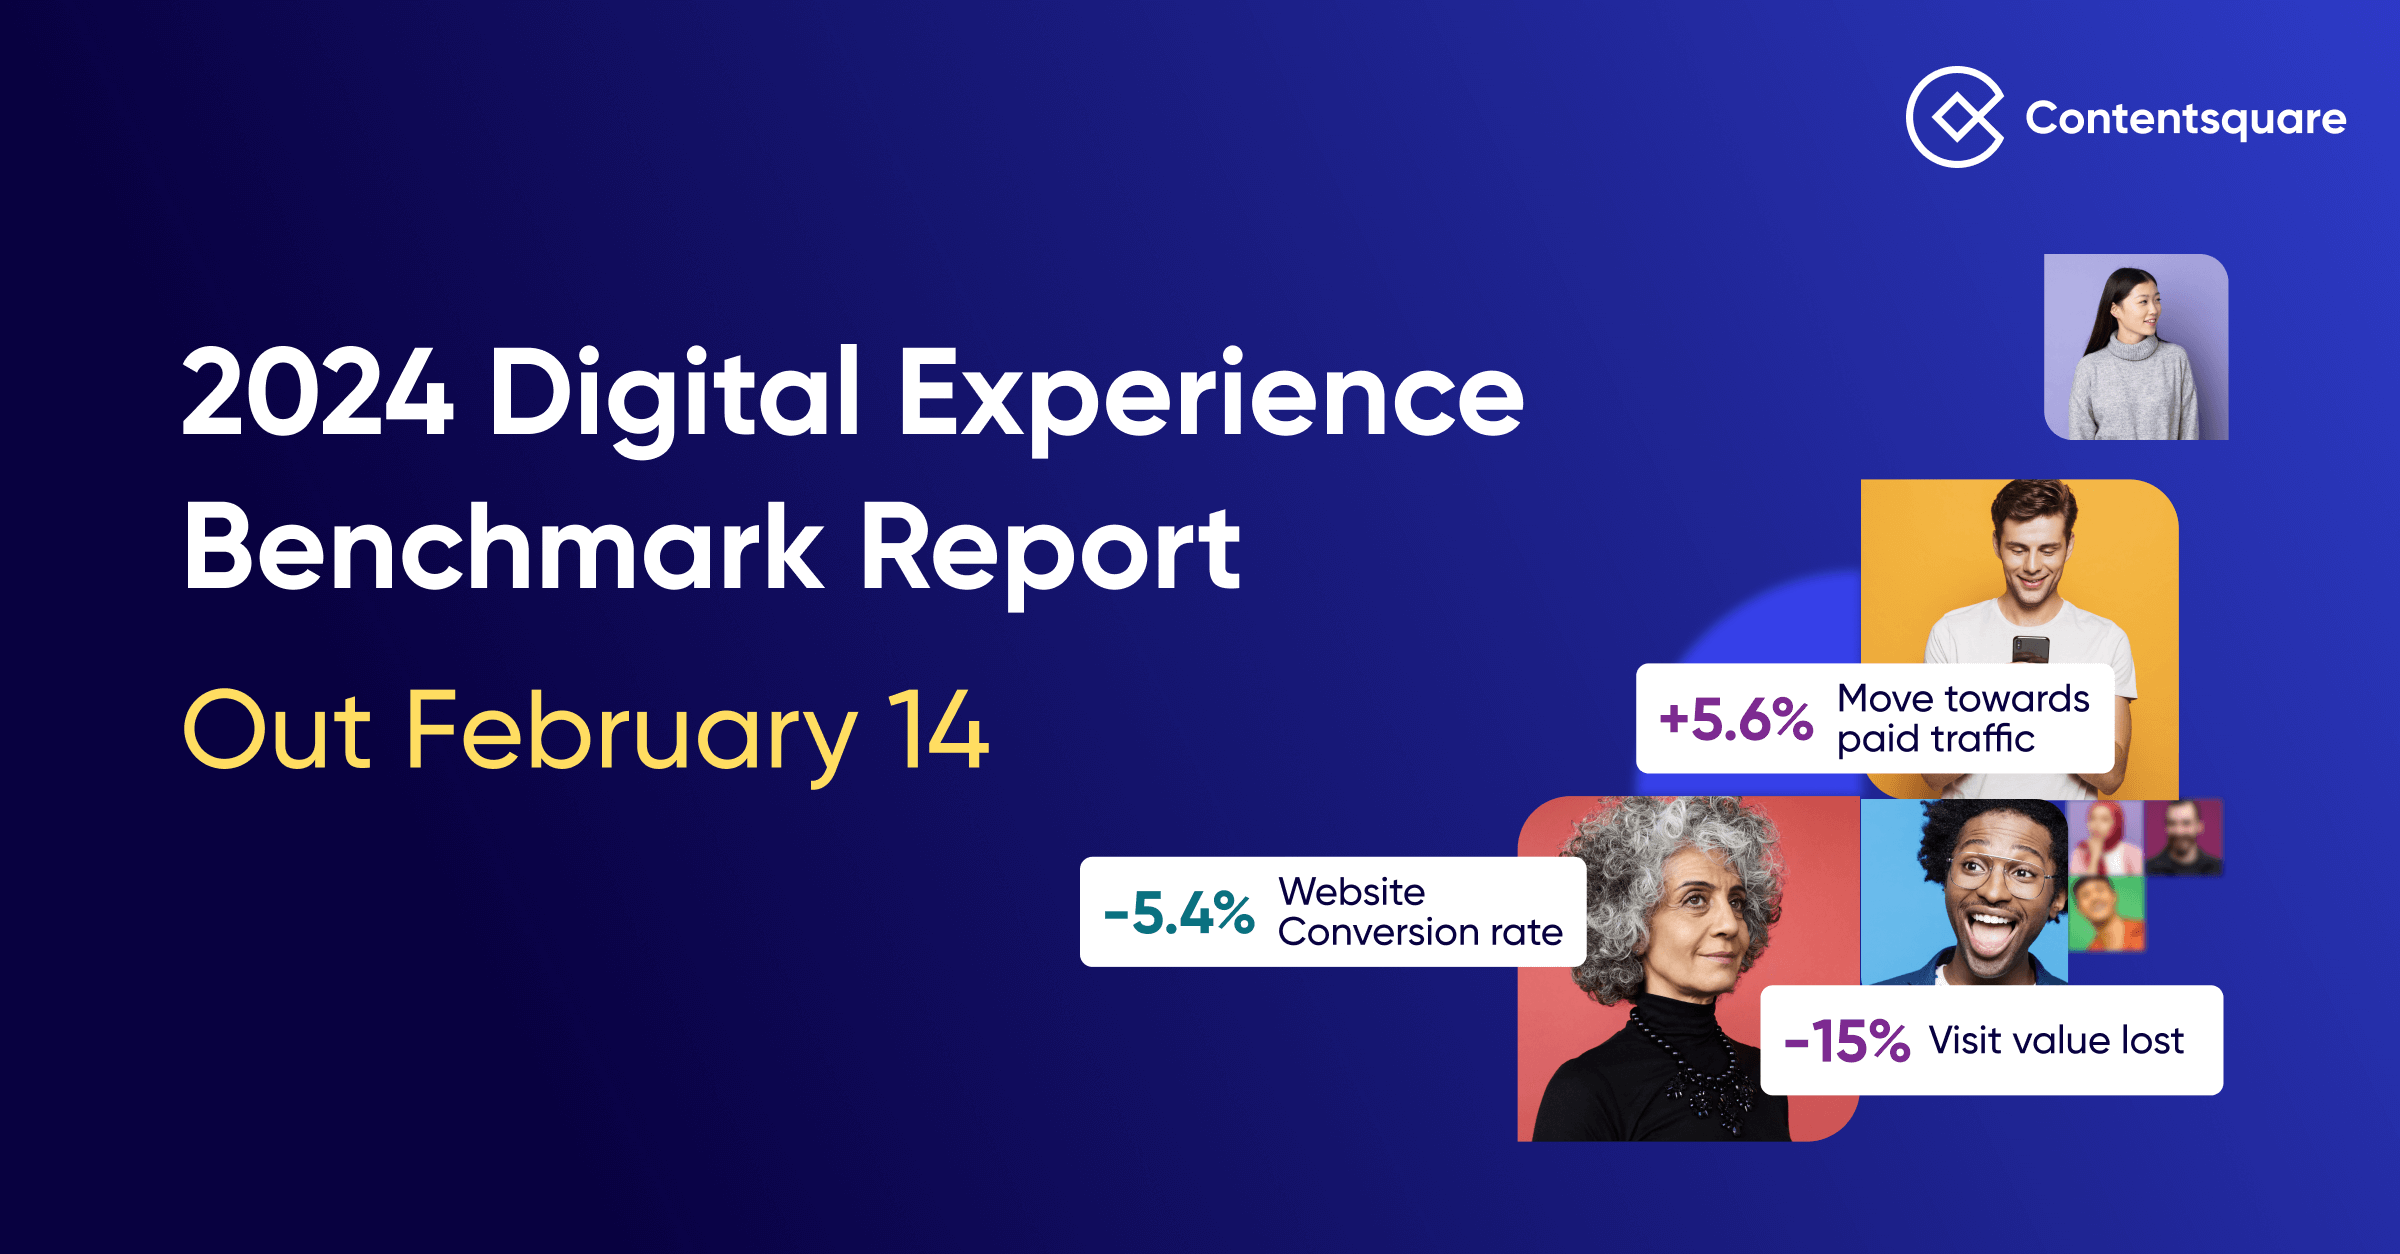
Report
2024 Digital Experience Benchmark Report
Pre-register for the most comprehensive analysis of the state of digital customer experience. Plus, get a snapshot of past trends ahead of the report.