BFL Group x Contentsquare

How BFL Group leverages Contentsquare’s real-time insights to accelerate business growth

The Company

The Brands for Less (BFL) Group is one of the fastest-growing off-price retailers of fashion and homeware in the Gulf (GCC) region. Based in the United Arab Emirates, it serves over seven markets across the Middle East and Europe. 

BFL’s most recent expansion strategy milestone was launching multiple stores across The Kingdom of Saudi Arabia (KSA), a brand new territory for the group. 

The Challenge

Entering a new market with minimal brand recognition is no easy feat—particularly when that market is as rapidly evolving as Saudi’s. For BFL, it has been an ongoing learning process.  

“We can't just copy-paste what we do in other markets,” said Mohammed Zeeshan, User Experience Manager at BFL Group. “Instead, we're trying to adapt to the way users in Saudi navigate on the website and app, which is completely different compared to other regions we operate in.”

BFL needed to understand the behavior and ever-changing needs of its Saudi customers to optimize its app and website user experience and support the most crucial part of its expansion plan: Increasing its conversion rate. And for that, they needed an analytics upgrade.


"
While looking for ways to improve conversion rate and reduce costs, we noticed our data was disconnected. We quickly realized that Contentsquare would provide us with the insights we needed."

Sunil Badu

Head of eCommerce
BFL Group

The Solution

Before using Contentsquare, BFL’s UX team relied on data taken from disparate analytics tools (including Google Analytics and Heatmaps), for its insights into user behavior. 

This scattered, disjointed data gave them only a partial picture of their user journeys, making it difficult to confidently action insights. 

“Without a complete overview of our user behavior, it was very hard to make UX changes,” said Mohammed. “But with Contentsquare, we get the full picture of how our consumers are using our site and app, and we don't have to toggle between different analytical tools.”

Crucially for BFL, the data provided by Contentsquare’s Digital Experience Analytics (DXA) platform is not just comprehensive, but real-time. “As an off-price retailer, our products don't live long on our site, so we need real-time data to make changes quickly,” said Mohammed. 

"
We use Contentsquare daily to monitor asset performance and make changes to our site. It would be challenging if we were completely dependent on Google Analytics or any other analytical tool."

Mohammed Zeeshan

User Experience Manager
BFL Group

Optimizing Product Description Pages (PDPs) for mobile user journeys

While analyzing Contentsquare’s Customer Journey Analysis, BFL’s UX team noticed a high bounce rate for mobile users on their PDPs. Users were searching on Google for specific products like Adidas shoes, landing on BFL’s PDPs and bouncing immediately. 

The team realized that this was due to BFL’s products not living on the site for long. “We use our PDPs on Google Ads but because of our business model, we tend to sell out of sizes quickly,” shared Mohammed. “By the time users land on the product page, it’s likely that the product is out of stock.”

Further analysis revealed that users were more likely to convert if they visited another product page directly after landing on the PDP. “Our analysis showed that if we get users to click other products, we’ll get more page views and better conversions,” said Mohammed. 

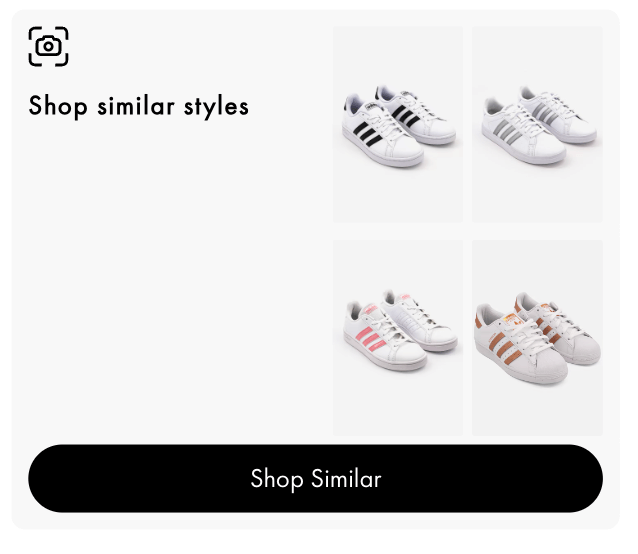
To encourage users to continue their journey on the site, the team introduced a ‘Shop Similar Styles’ section, using its product recommendation engine widget, which shows users similar items they might be interested in buying. 

Adding this section has helped BFL reduce PDP bounce rates by -2.18% and exit rates by -9.41%. Conversion rates have also increased by +6.51% for mobile users landing on the PDP. 

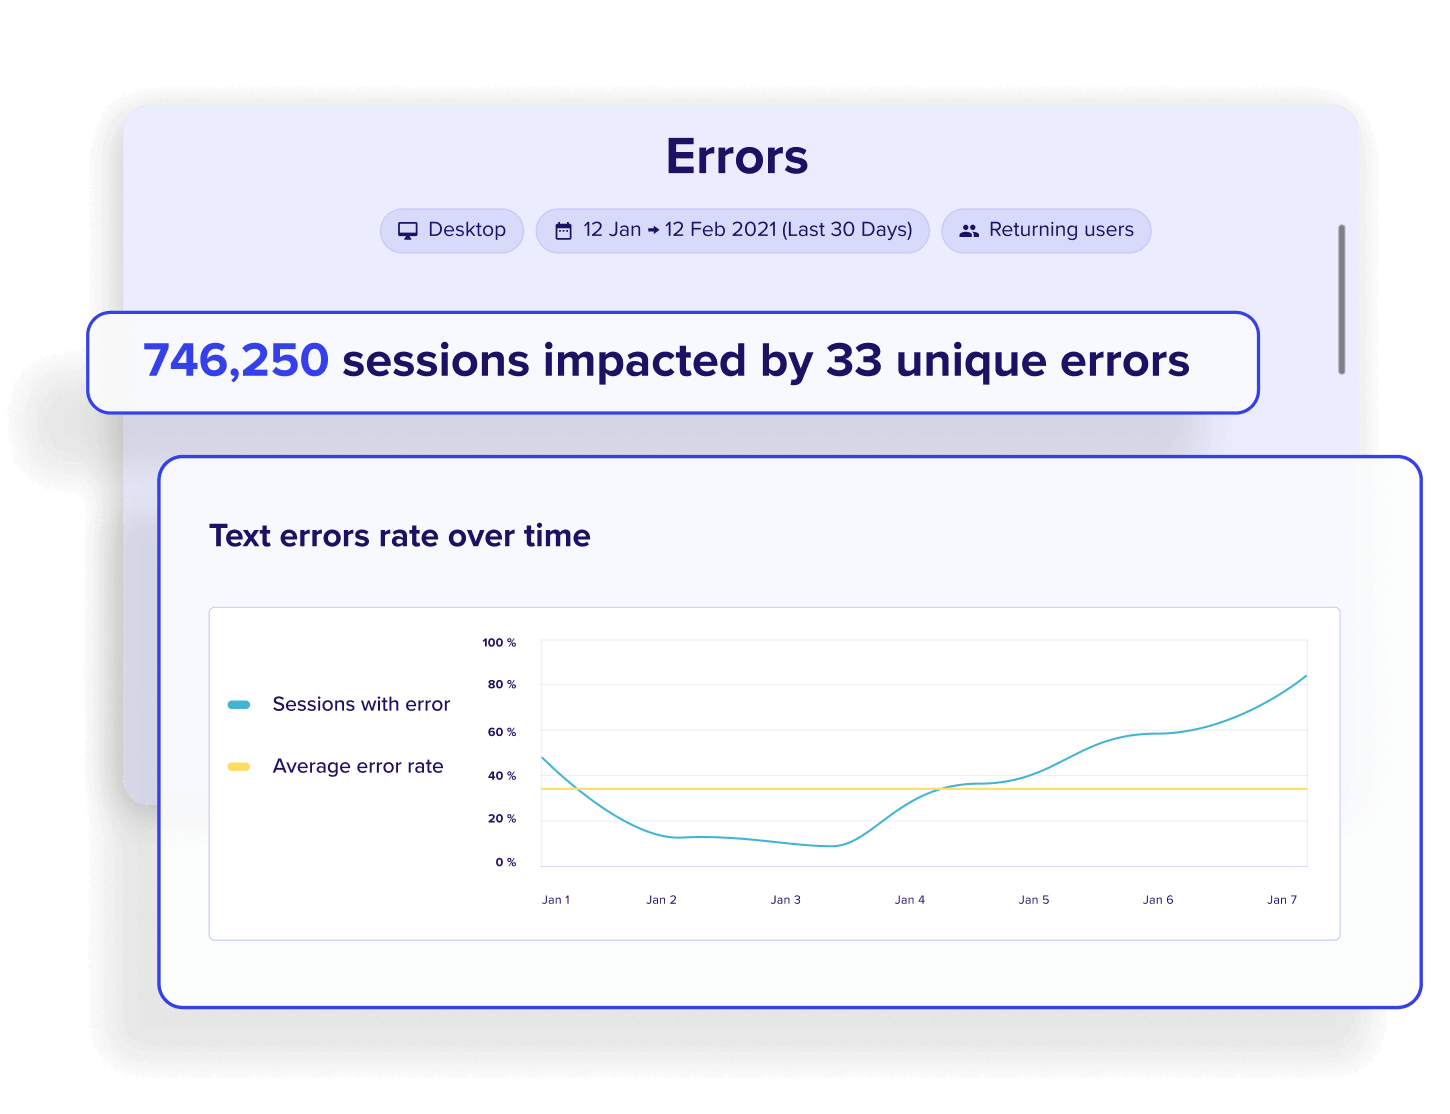
Furthermore, using Impact Quantification the UX team estimated that the new section increased its annual revenue by a projected +377K AED (+102K USD). 

"
Contentsquare has helped us get a deeper picture of what’s happening on our website and app, and how our customers interact with us. We now have a better understanding of how we can guide them."

Anjali Sreekumar

UX Executive
BLF Group

The Results

By leveraging Contentsquare, BFL is able to get a full picture of its user behavior across markets, easily measure the impact of its optimizations and enrich other features (like its product recommendation engine) that run on its app and website.

"
Contentsquare is a great platform for us because, while we're good at bringing in traffic, converting that traffic has been a pain point. Contentsquare plays a crucial part in our digital strategy, providing us with invaluable insight that helps us optimize for conversions."

Sunil Badu

Head of eCommerce
BFL Group

What's next

The BFL UX team are Contentsquare power users—the platform is an integral part of their daily work and they provide actionable insights to other teams, like merchandising and marketing. In fact, Mohammed and Anjali are both Contentsquare Quarterly Champions, which means they’re among the top 250 most active users across the globe. 

“We’re trying to be more agile with how we work with data and how we can use Contentsquare for experimentation and A/B testing for example,” said Mohammed. 

BFL also plans to onboard the Contentsquare platform across all its digital teams so that everyone has access to the same real-time behavioral insights. 

Learn how Contentsquare can help transform your business

  • Case Study

    How Calzedonia saved $20K per year by removing under-performing content from the homepage

    Read more about the team at Calzedonia used Contentsquare's behavioral analytics to work more efficiently and save $20k a year in maintenance in costs.

  • User segment zone tracking metrics

    Capablities

    Zone-Based Heatmaps

    Reveal how users interact with each element on your website; understand what makes them click, what elements attract their attention, and what content makes them bounce. Go beyond basic analytics metrics to understand why your users behave as they do online.

  • Blog

    How execs use digital experience analytics (DXA) to optimize and maximize technology investments

    Last year, rapid digital maturity saved and enhanced many previously digitally immature businesses. Read about how taking the right actions on digital experience transformation can help in shaping the success of businesses this year and next.

Interested in a personalized demo on your own data?

Request a demo