Access the full report

2023
Digital Experience Benchmark

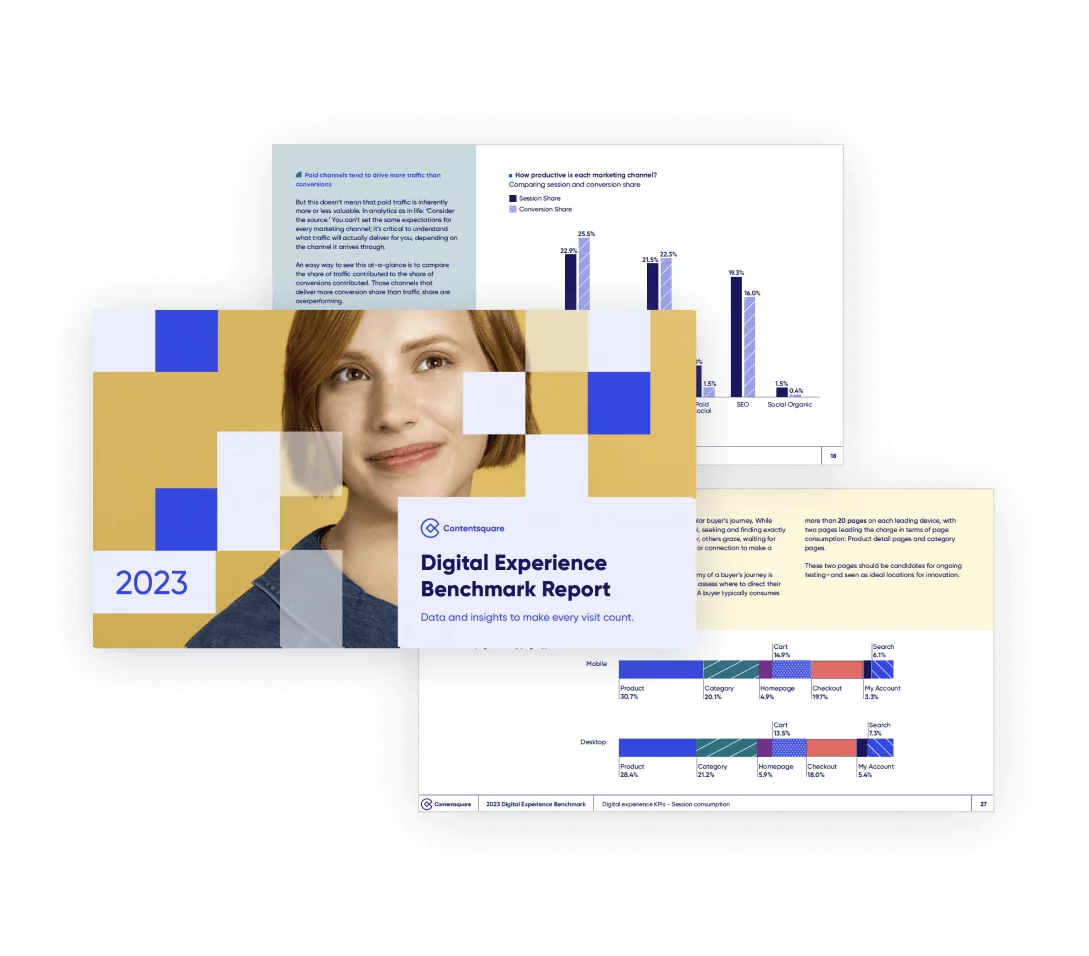
User Experience Report and Interactive Explorer

User frustration affects one-third of visitor sessions, but sites with high customer engagement drive 19% higher conversion rates. Measure what matters most to your users and optimize customer satisfaction to drive growth.

  • 161 billion

    Page views

  • 35 billion

    Site visits

  • 2,942

    Websites

  • 26

    Countries

  • 9

    Industries

Preview the customer experience (CX) metrics covered

The digital landscape saw a mix of results in 2022, with traffic showing an upward trend of 5%, while user conversions experienced a slight dip of 3%. The key to CX success? Understanding the customer journey. The 2023 Digital Experience Benchmark explores the entire user experience to help you optimize experiences, convert customers and fuel growth. 
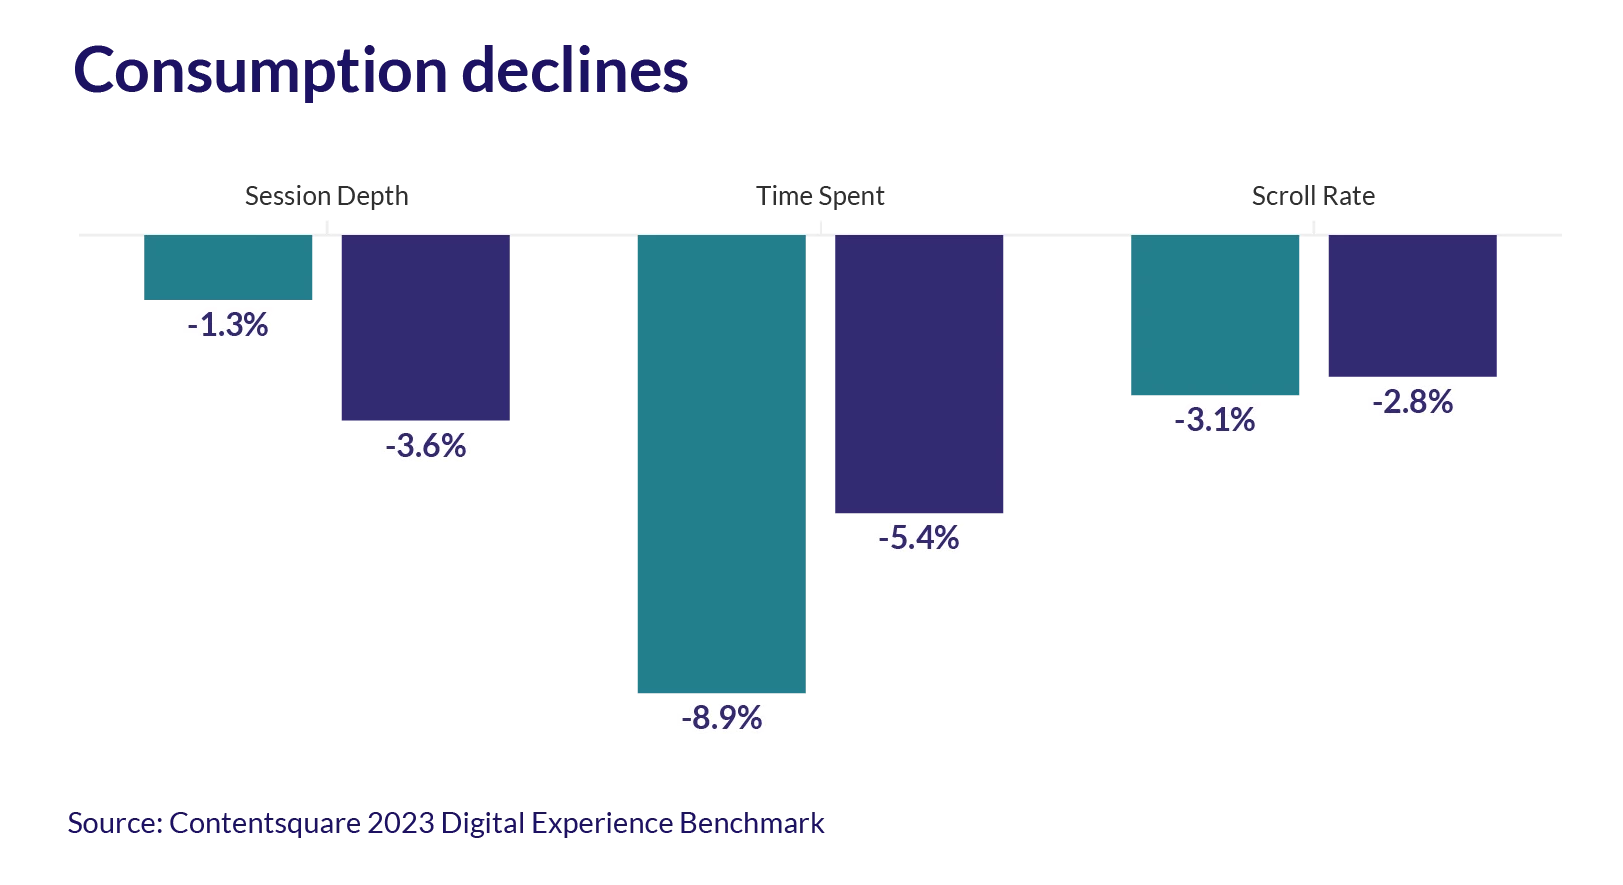
More, yet shorter sessions, fuel consumption concerns

We observed a decline in consumption characterized by shorter visits and decreased user engagement metrics such as average time spent on website, fewer page views, and shallower scroll rates.

Could this signal the onset of a consumption crisis?

User frustration is a reality across the journey

Over a third of sessions result in frustration for visitors, with slow-loading pages being the primary source of friction and having the most significant negative impact.

Maximize revenue through active user engagement

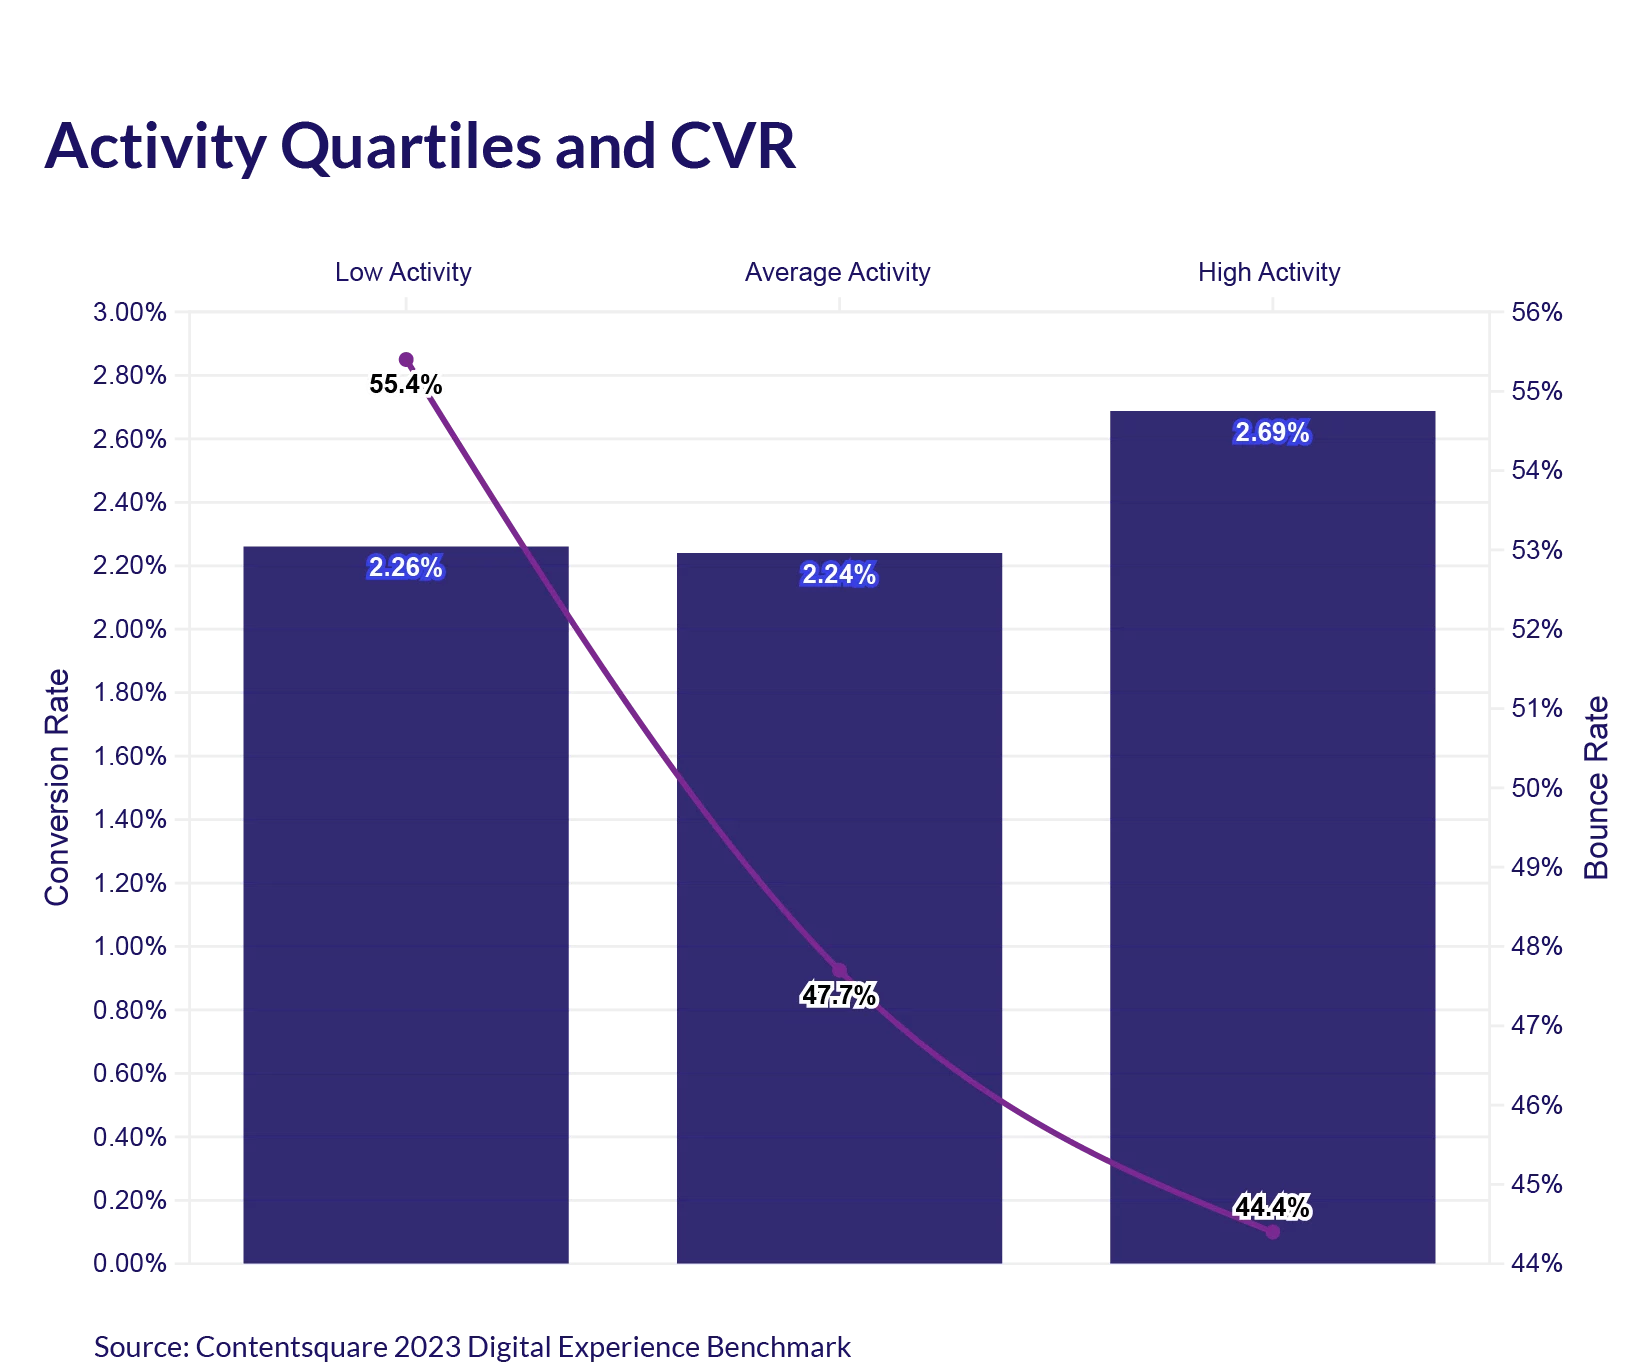
High levels of customer engagement result in 1.7 times more page views and a 19% increase in conversion rates compared to those with low engagement.

What's inside

  • Industries included

    Retail, travel and hospitality, telecommunications, financial services, software and more

  • Who is this for

    From executives to team leads to CX pros, pinpoint areas throughout the digital journey to increase efficiency, delight customers and unleash growth

  • Two formats

    Get your copy of the Digital Benchmark Report, as well as access to the Interactive Explorer for the most comprehensive and unique strategic data on digital CX available

See how your digital experiences stack up.

Read our other reports

  • 2023 Retail Digital Experience Benchmark cover

    Retail

    2023 Retail Digital Experience Benchmark

    Measure what matters most to your customers to optimize engagement, boost efficiency, fuel customer satisfaction and drive ROI and growth.

  • Financial Services

    2023 FinServ Digital Experience Benchmark

    The 2023 Financial Services Digital Experience Benchmark explores the entire customer experience to help you pin-point opportunities to improve your journeys, delight more customers and see real growth.

  • Travel & Hospitality

    2023 Travel & Hospitality Digital Experience Benchmark

    The 2023 Travel & Hospitality Digital Experience Benchmark explores the user experience on travel and hospitality sites from end-to-end, helping you pin-point opportunities to improve your customer journey, delight more customers and see real growth.

  • Read the B2B Digital Experience Benchmark report to improve your B2B digital customer journey

    B2B

    2023 B2B Digital Experience Benchmark

    The 2023 B2B Digital Experience Benchmark explores the user experience on B2B sites from end-to-end, helping you pin-point opportunities to improve your buyer’s journey, delight more customers and see real growth.

More. Human. Analytics.

Learn More