How to improve your homepage
35+ actionable insights for getting the most out of your homepage.

To understand how consumer activity and behavior change during the holiday shopping season, Contentsquare analyzed over 2.6 billion sessions and 12.7 billion pageviews from eight countries from Oct. 1 to Nov. 28, 2022.
Throughout this piece, “normal” refers to regular, non-holiday activity tracked from Oct. 1 to Nov. 20, and “peak” refers to holiday shopping activity from Nov. 25 to Nov. 28—Black Friday/ Cyber Monday weekend.
The busiest day of the busiest season is Black Friday, where traffic increased by 34% and purchasing sessions by 85% from the previous day.
By comparing normal vs peak season activity, we can understand how consumer behavior and preferences have evolved since last year and what shopping trends retailers should expect in 2023.
Across retail, mobile made up 77% of all traffic during peak, a 4% increase year-over-year (YoY) and a 6% increase over normal traffic in 2022. Mobile also made up 65% of all buying sessions during peak, 5% more than normal. Shoppers didn’t just use mobile to browse; they regularly finished the buyer journey and completed the transaction on mobile.
The highest increase in mobile traffic and conversions was on Black Friday, with 35% more traffic and 27% more conversions than normal.
Holiday shopping behavior for retail and eCommerce brands can vary significantly based on the sub-vertical. For example, consumer electronics and technology products are known for big savings on Black Friday, whereas grocery doesn’t have that same expectation of discounts.
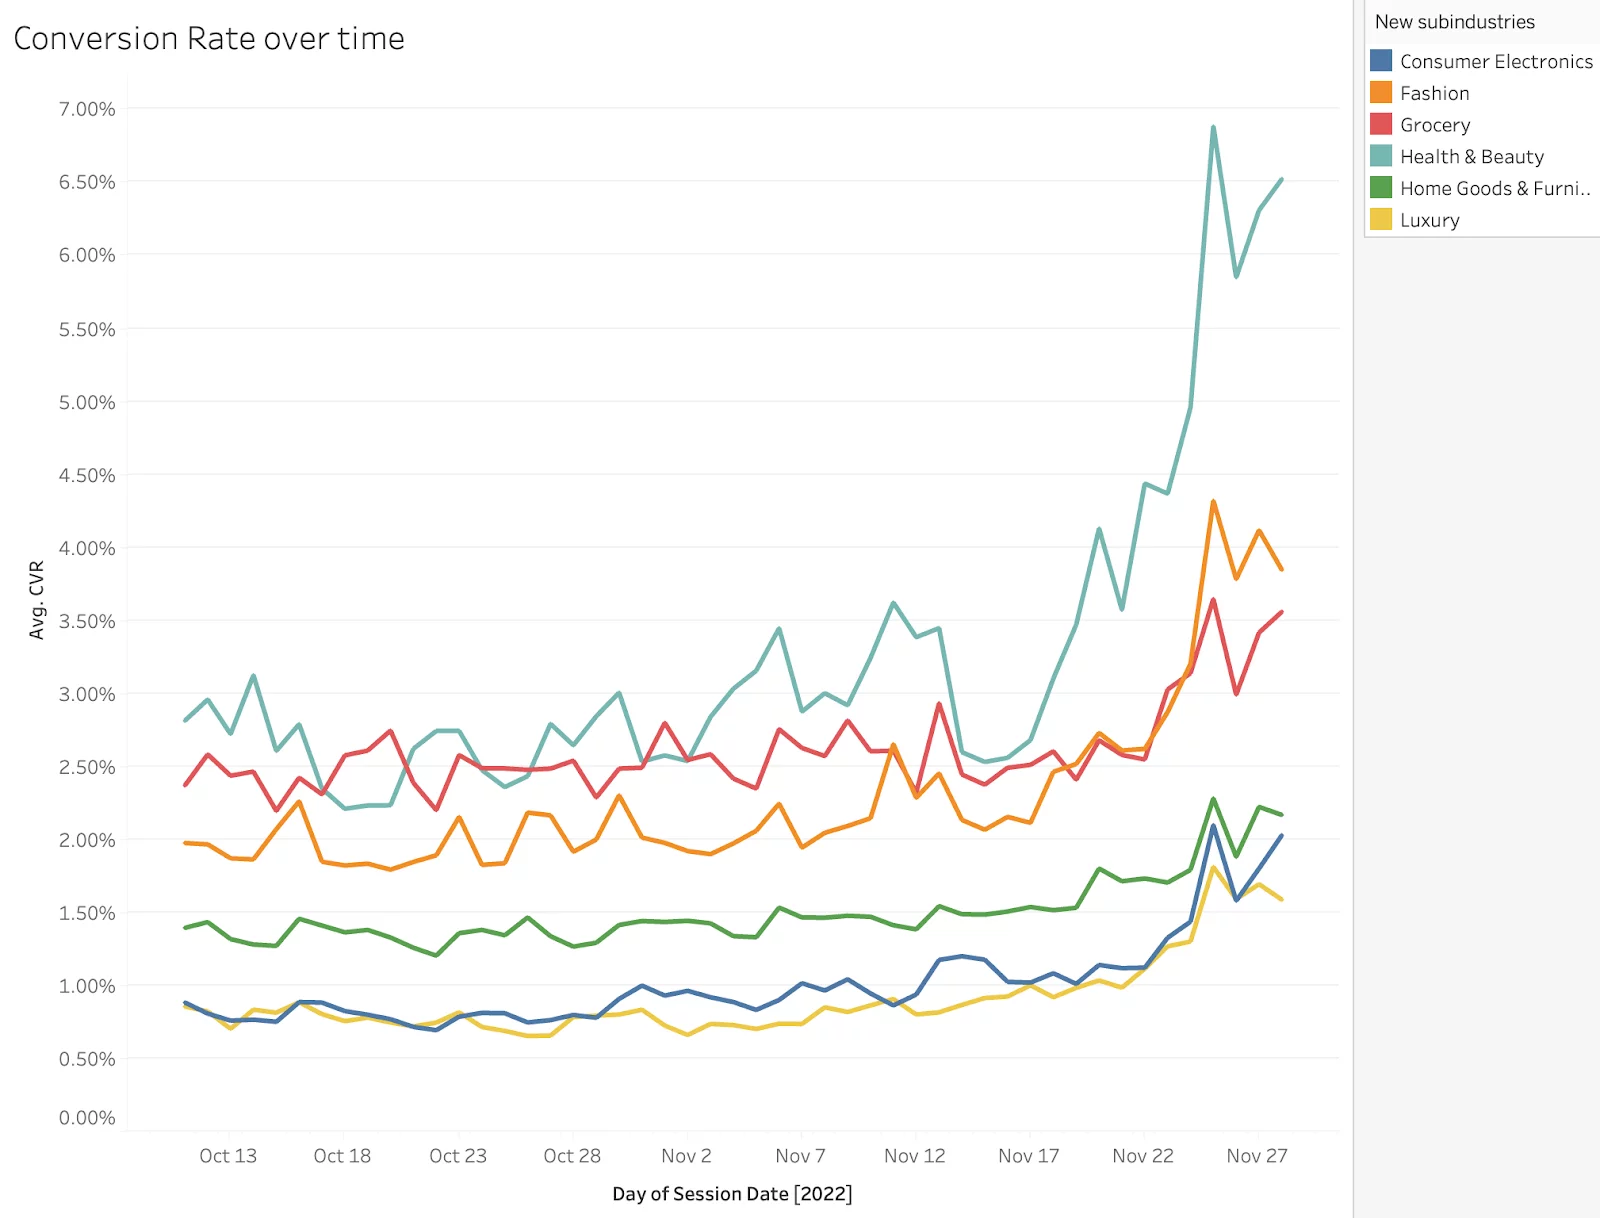
To get a better understanding of just how much it varies, Contentsquare analyzed six sub-verticals within the industry: Consumer Electronics, Fashion, Grocery, Health & Beauty, Home Goods & Furnishings and Luxury.
Out of all the sub-verticals analyzed, Health & Beauty had the highest increase in conversion behavior during peak. It had the highest desktop and mobile conversion rate increases from normal, with 124% and 105%, respectively. While Grocery had the smallest conversion increase, it was still an impressive 36% over normal.
Health & Beauty also had the highest rate of visitors making it to the cart page with 9%, while Grocery tied with Home Goods & Furnishings for the lowest rate of 3%.

Conversion rate by retail sub-vertical
Errors continue to create friction and hinder customer experiences during the holiday shopping season. Site errors can lead to more bounce and abandonment rates and fewer repeat customers. With the retail industry average bounce rate at 48%, brands need to do everything they can to reduce errors or friction when visitors arrive on the site.
During peak, 16% of all visitor sessions experienced errors, 21% higher than normal.
With an unpredictable economy, many shoppers waited for the holiday shopping season to purchase gifts and large-ticket items to save money. Unlike the previous few years when people had stimulus checks and a lot more time to shop online, 2022 represented a different holiday shopping pattern which will likely continue in 2023.
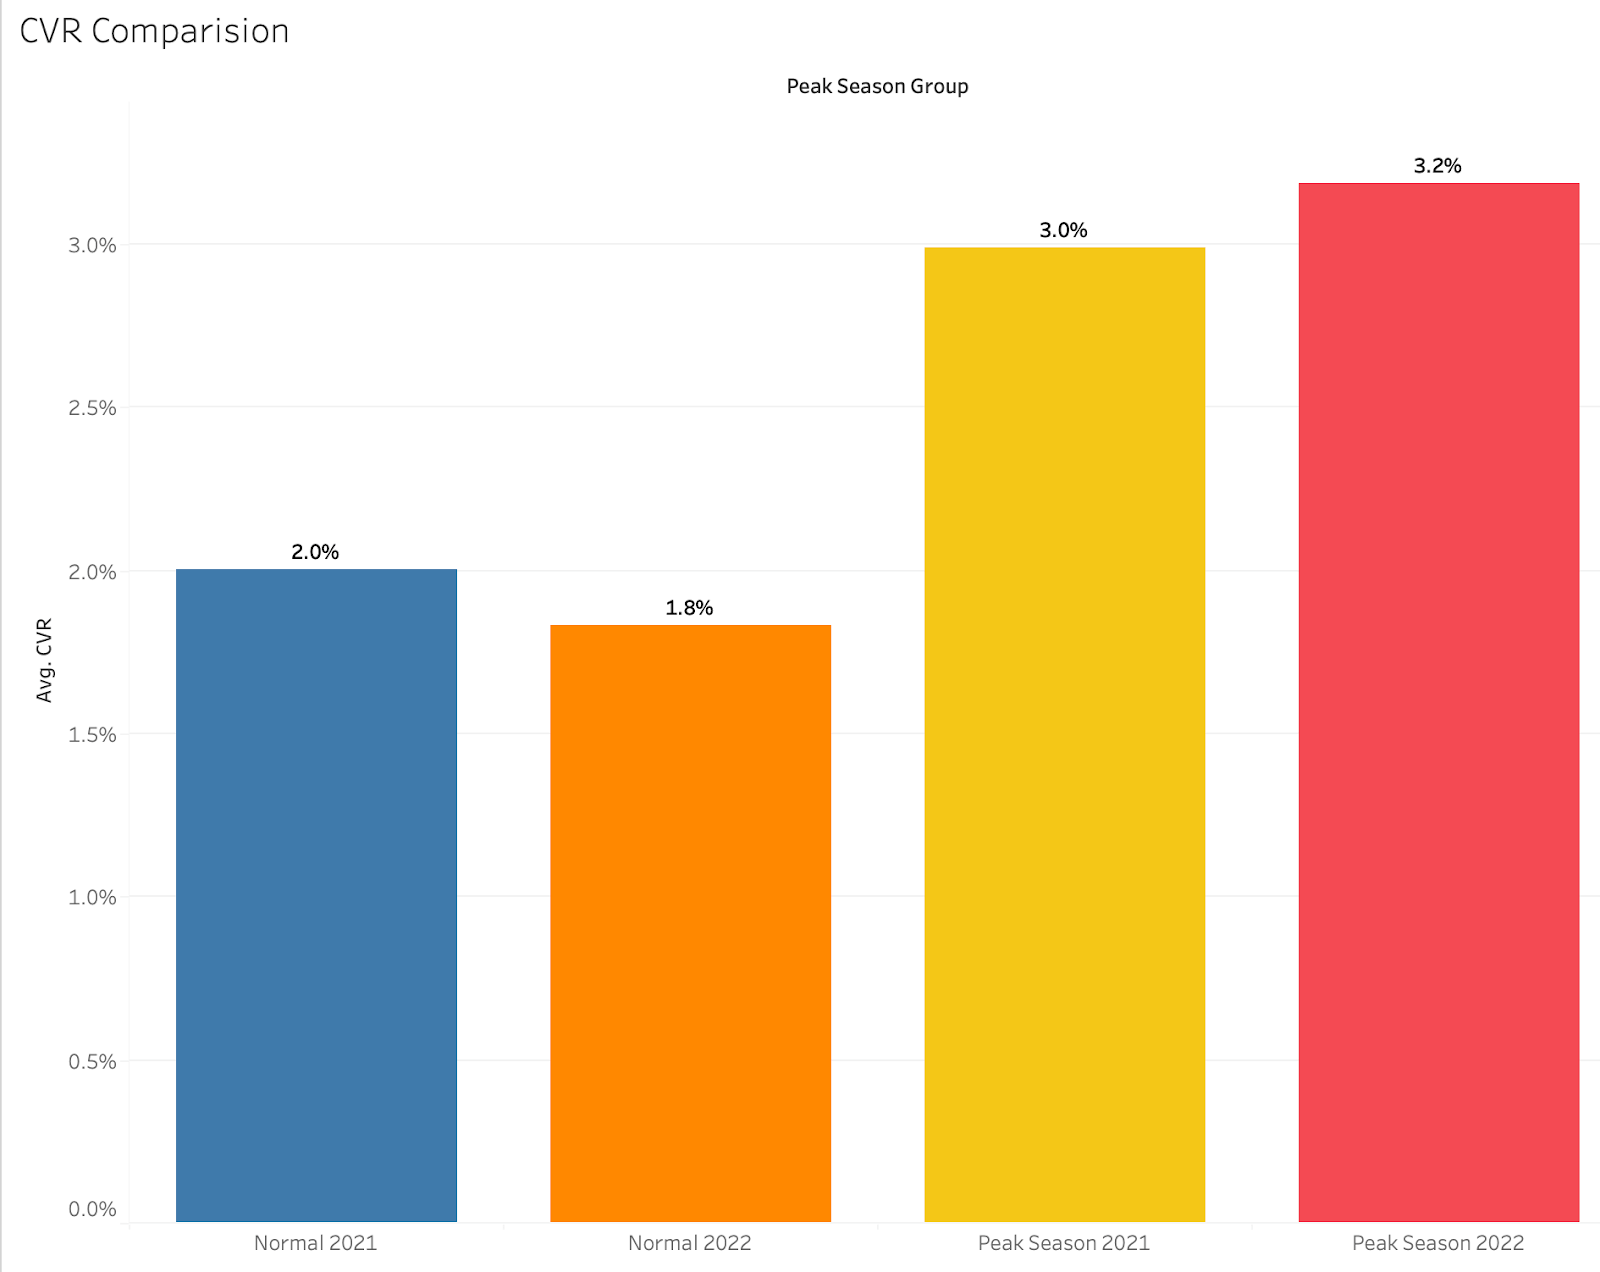
Shoppers continued to convert at significantly higher rates during peak and outperformed the previous year. Conversions for retailers increased by 50% during peak in 2021 and continued to climb in 2022, with 78% in conversions over normal.
The normal conversion rate in 2021 across retailers was 2% and increased to 3% during peak, spiking 50%. In 2022, the normal conversion rate was 1.8% and increased to 3.2% during peak, a 78% increase.

Conversions during ‘normal’ vs ‘peak’
Black Friday offers deep discounts, which is why the average cart value is lower during peak than normal. However, the percentage decrease varies significantly based on the sub-vertical.
Luxury had the most significant decrease, with a 25% reduction in average order value. Fashion had the second-largest reduction, with an 11.3% decrease in cart value. Health & Beauty had the lowest reduction in average order value with just a 3% decrease.

How to improve your homepage
35+ actionable insights for getting the most out of your homepage.