See how your digital experience stacks up.
Download the 2024 Retail Digital Experience Benchmark Report for the metrics that really matter.

However, this shift also comes with new and unique challenges.
Digital advertising costs have surged and consumer attention is becoming increasingly fragmented, leaving retailers grappling with fewer page views and rising visitor frustration.
Add echoes of recession to that list and one thing becomes clear as day: Retailers need to adapt to this new reality—and do it fast.
Here’s the good news: With the right insights, your digital team can strategize to make your customer experience a consistent growth engine for your business this year—driving more conversions and a better eCommerce ROI.
And we know just where you can find those insights: In the 2024 Retail Digital Experience Benchmark Report.

See how your digital experience stacks up.
Download the 2024 Retail Digital Experience Benchmark Report for the metrics that really matter.
(If you’re after some general practical guidance on optimizing for conversions, don’t forget to bookmark our guide to Conversion Rate Optimization).
Keep reading to find out more about what’s inside the report and what you’ll get out of it, plus a preview of five key insights that our analysis has revealed.
In putting together this year’s retail benchmark report, we’ve analyzed 2023’s digital customer experience data, from over 25 billion site visits that happened across 1,673 retail sites, 23 countries and 10 retail verticals:
Our findings will enable you to benchmark your business’s performance against your competitors. We’ve rendered them in snazzy graph and chart form, making them super accessible for you and your colleagues, and easily shareable with your execs.
We’ve also packed the report full to bursting with insights, strategies, best practices and predictions that should help you delight customers, beat the benchmark for 2024 and grow your business in spite of continuing economic pressures.
According to a recent Deloitte survey, almost a third (30%) of retail companies see ‘managing inflationary pressure and reducing costs’ as their number one priority for 2024. Despite signs that inflation is in retreat, consumers are still struggling and consumer uncertainty is high.
While technology is seen by Deloitte (and many retail executives) as a means of generating cost-saving efficiencies, the pressure to cut costs could imperil potentially vital technology investments and damage the digital customer experience when it most needs strengthening.
The 2024 Retail Digital Experience Benchmark Report contains the data and insights you need to make growth-generating strategic decisions about your digital customer experience with real confidence, and to instill that same confidence in the decision-makers holding the purse strings.
Now here’s a taster of what you’ll get from reading it: five insights into the digital customer experience landscape in retail in 2023 that will point you in the direction of conversions, revenue and growth in 2024.
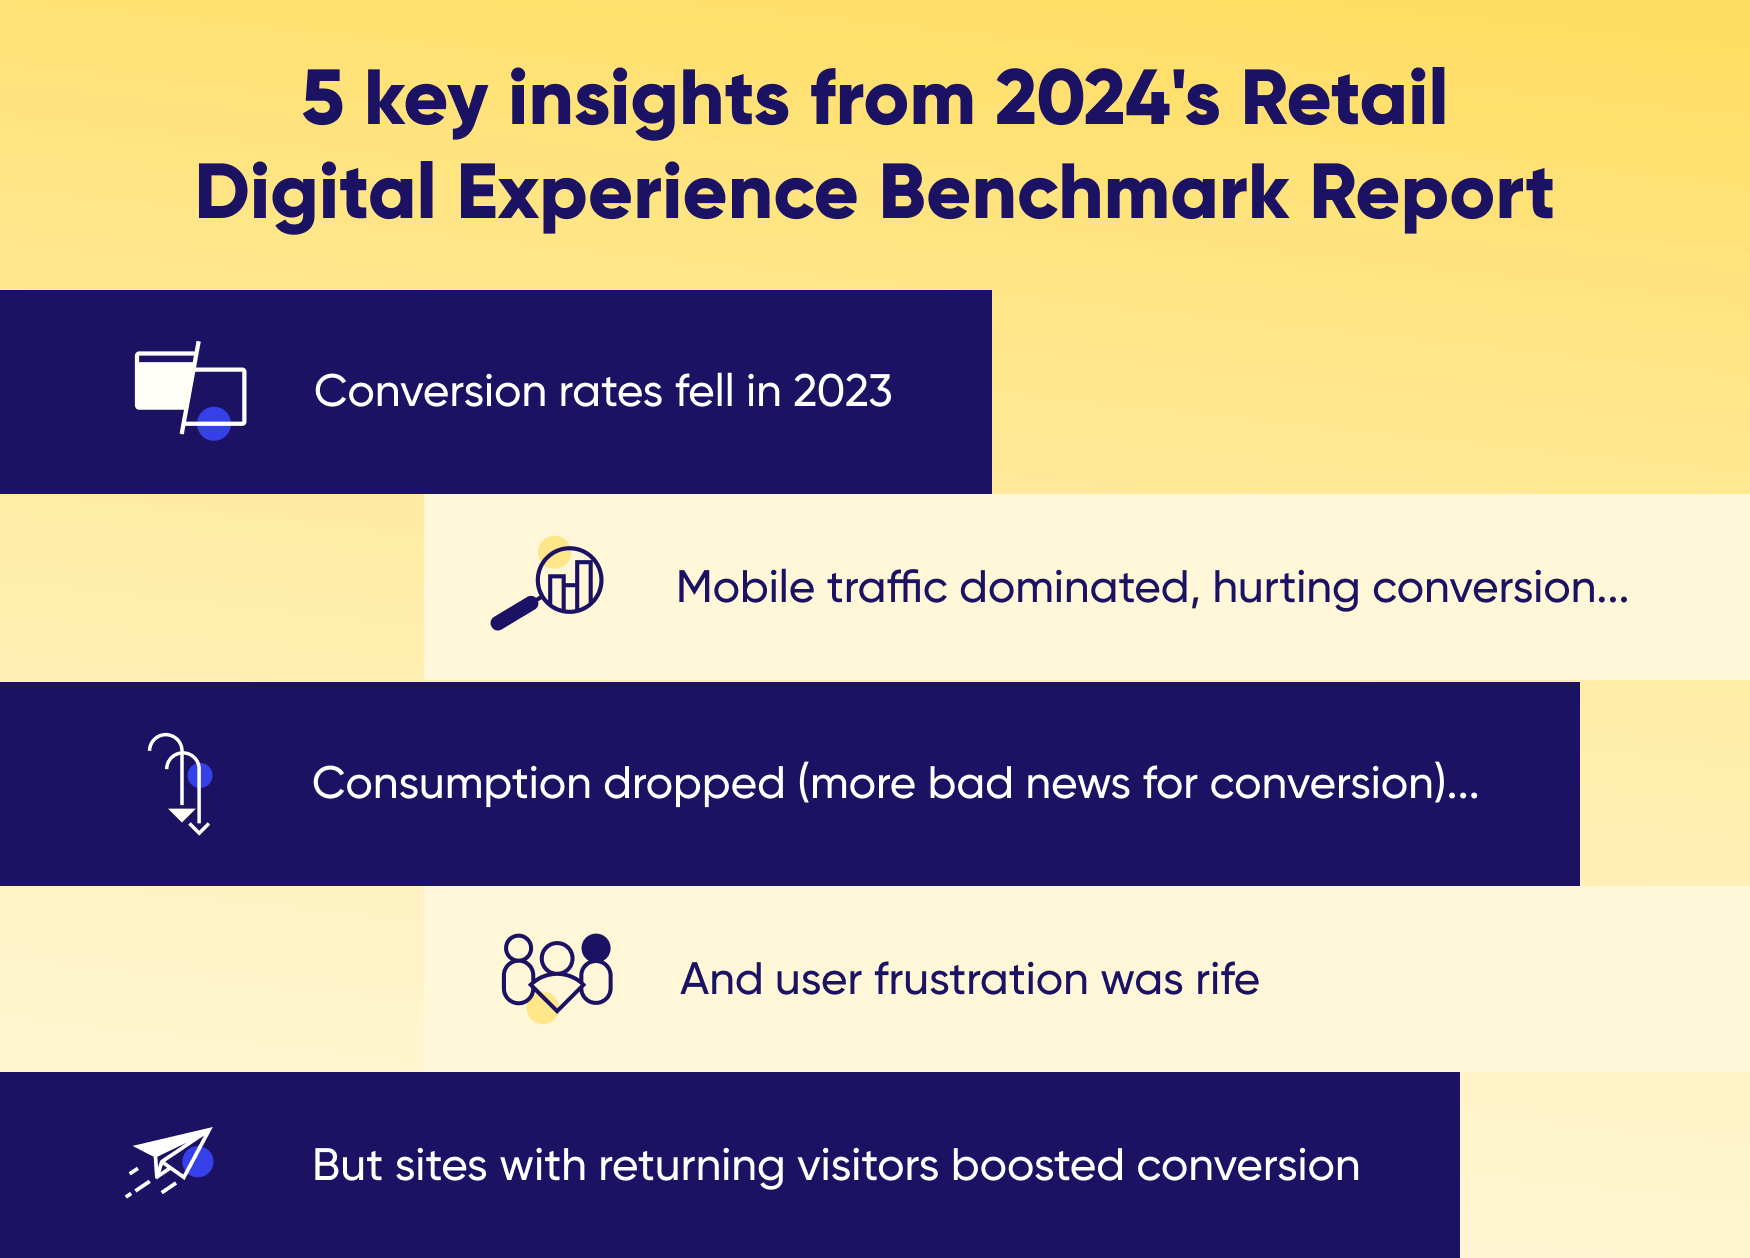
To be more precise, conversion rates dropped -5.8% in 2023 from the previous year, falling to 2.59% in Q4 2023. Meanwhile, bounce rates were up by +1.3% year-on-year, up to an eye-wateringly high 46.4%.
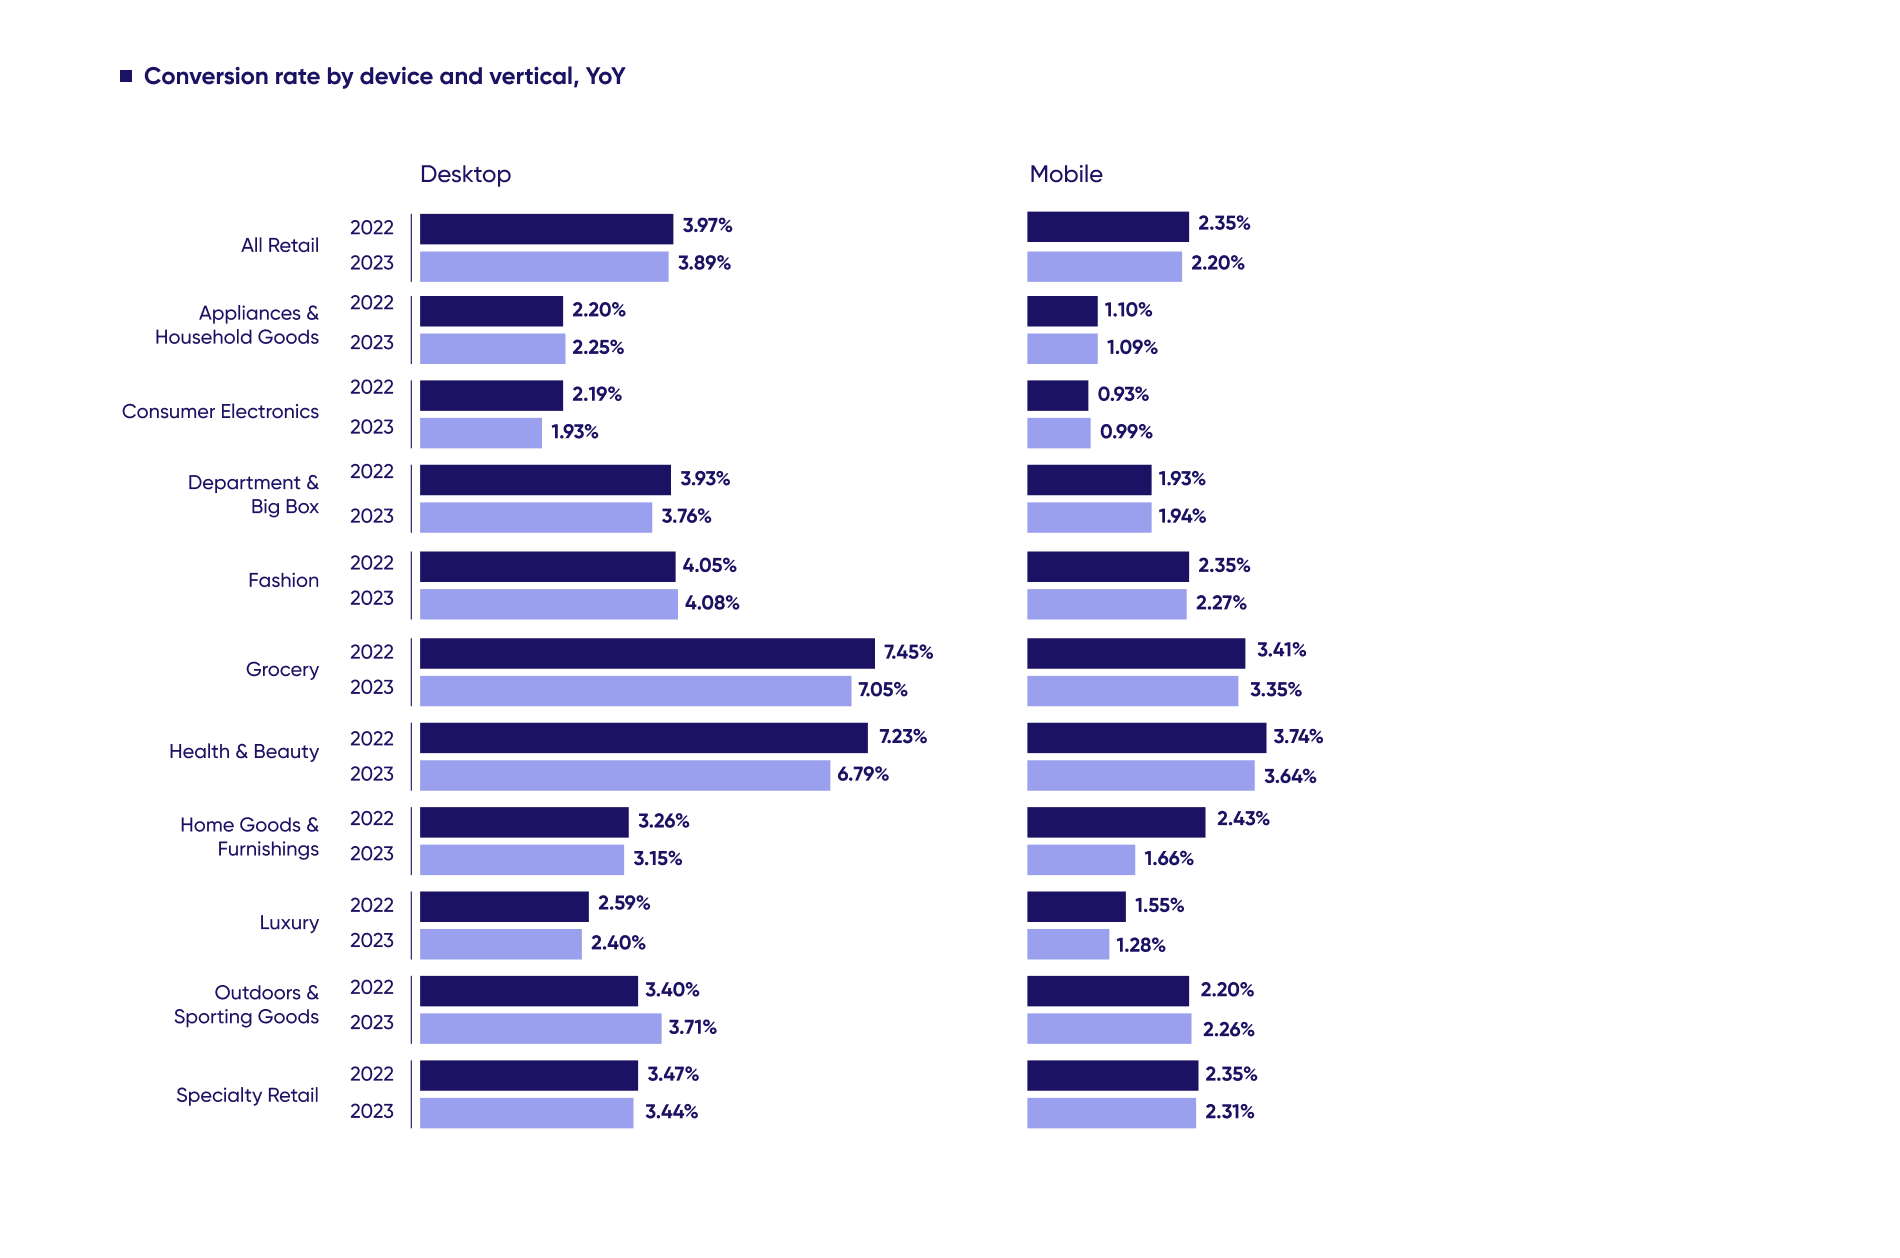
These metrics by themselves don’t tell us much—except that retailers should be concerned.
There’s more context on conversion to be found in our report, where we look at related metrics (such as average order value and revenue per visit) and the surprising reason why overall bounce increased, even though desktop bounce rates actually improved in 2023.
To understand why conversion rates are dropping and bounce rates are rising, and to move the needle in the right direction on those all-important outcomes, retailers need to understand the full customer journey.
That’s what the 2024 Retail Digital Customer Experience Benchmark is designed to help with. And it starts with understanding where visitors are coming from. Literally.
See how your digital experience stacks up.
Download the 2024 Retail Digital Experience Benchmark Report for the metrics that really matter.
The year’s biggest story: Retail traffic fell -5.0%, with 57% of sites seeing less traffic in 2023 than in the previous year.
We delve into which sources this diminished traffic came from and the types of visitors brought in with it in our report, but here we’ll focus on a big factor in bringing conversion rates down: The continuing growth of mobile traffic.
Nearly 3 out of 4 (77%) visits to retail sites in 2023 came via mobile, and this device type drove more than half (56.3%) of the total revenue for retail sites in 2023—up 3 percentage points from 2022.
However, despite driving less than 1/4th of all traffic, desktop delivered nearly twice that amount in revenue. That’s because conversion is lower on mobile than desktop, at only 2.20% compared to desktop’s 3.89%.
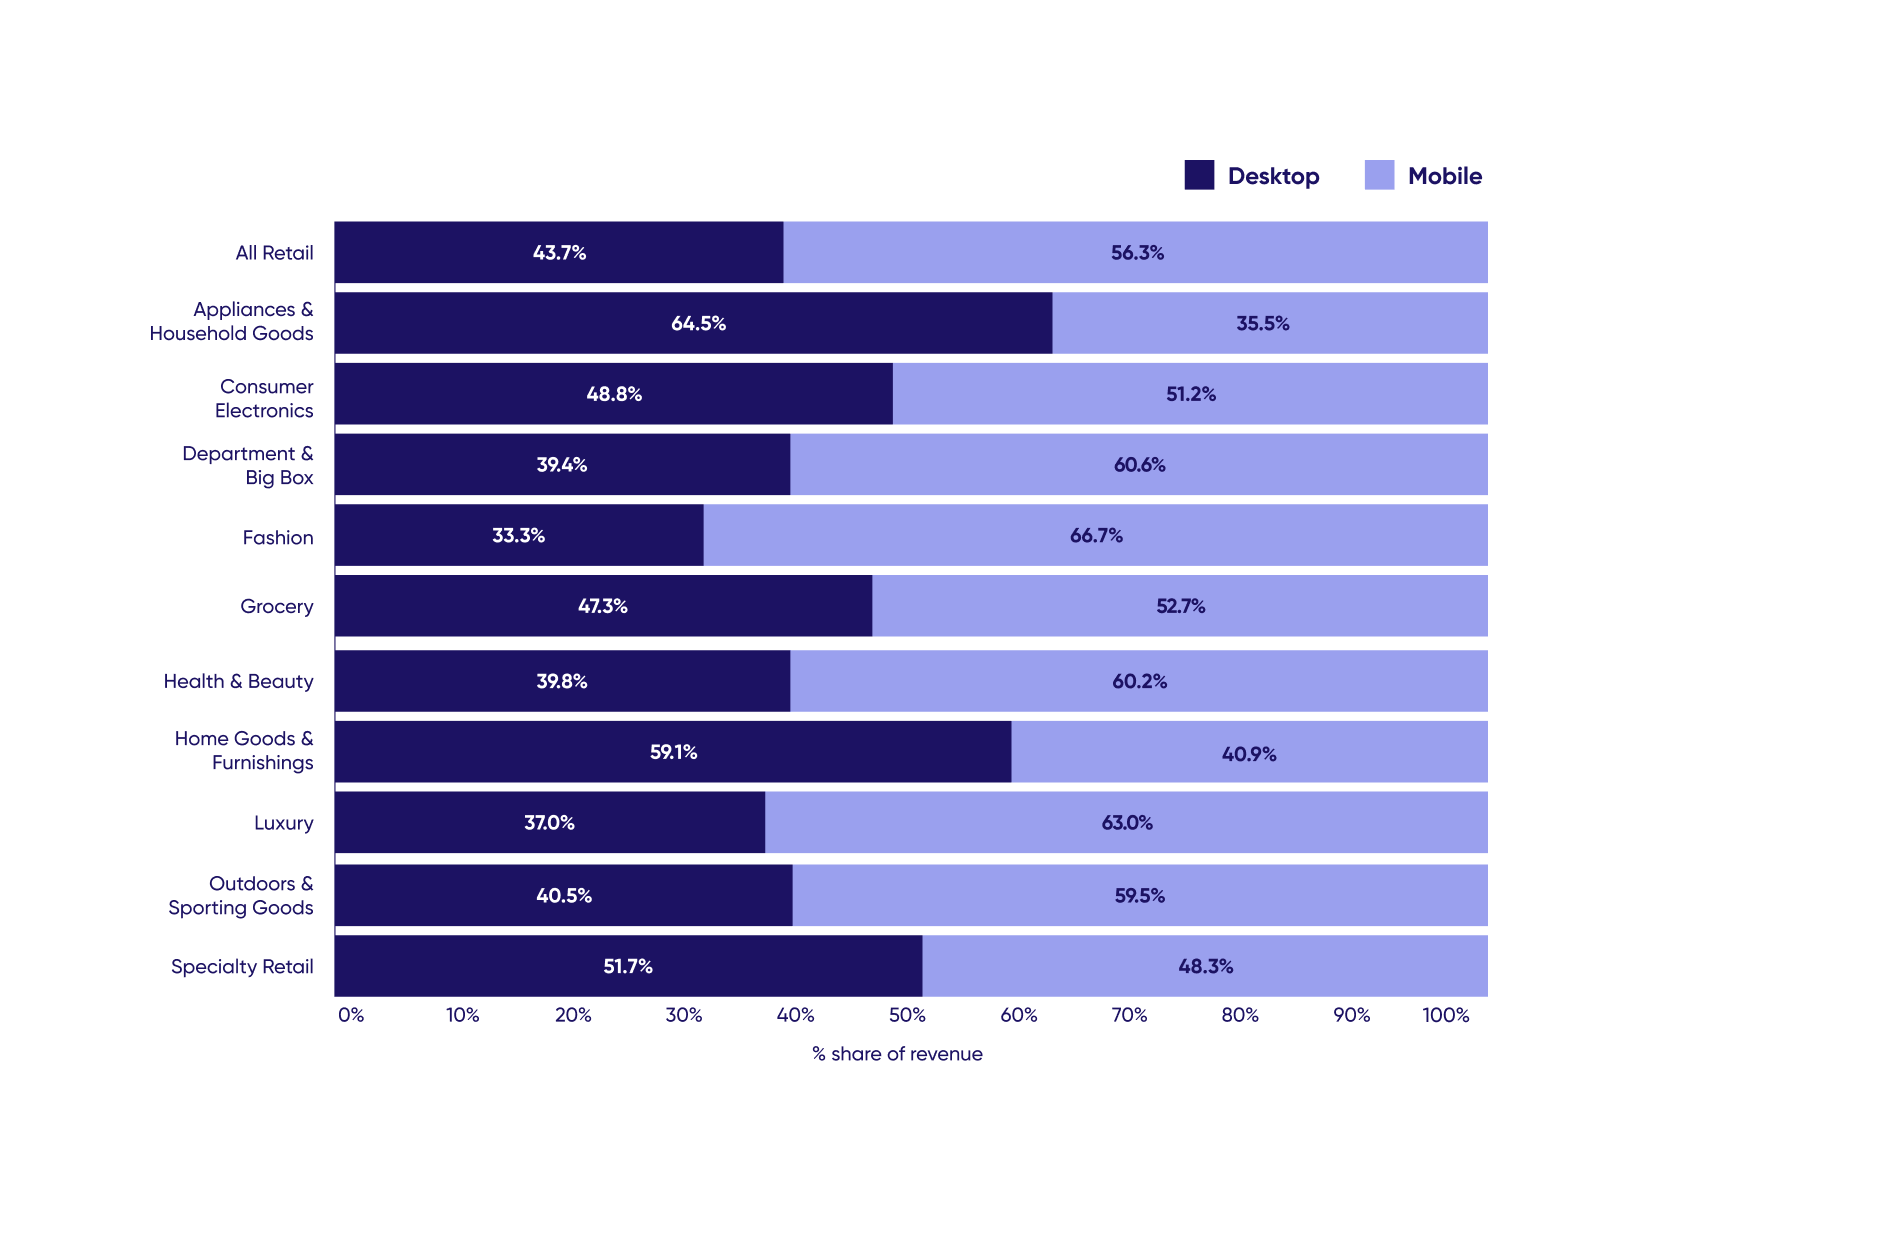
These statistics show that eCommerce leaders urgently need to invest in optimizing mobile experiences to stimulate conversion rates.
They should also ensure that desktop and mobile experiences are seamlessly integrated, making it easy for shoppers who still prefer desktop over mobile for making purchases to complete on desktop what they’ve started on mobile.
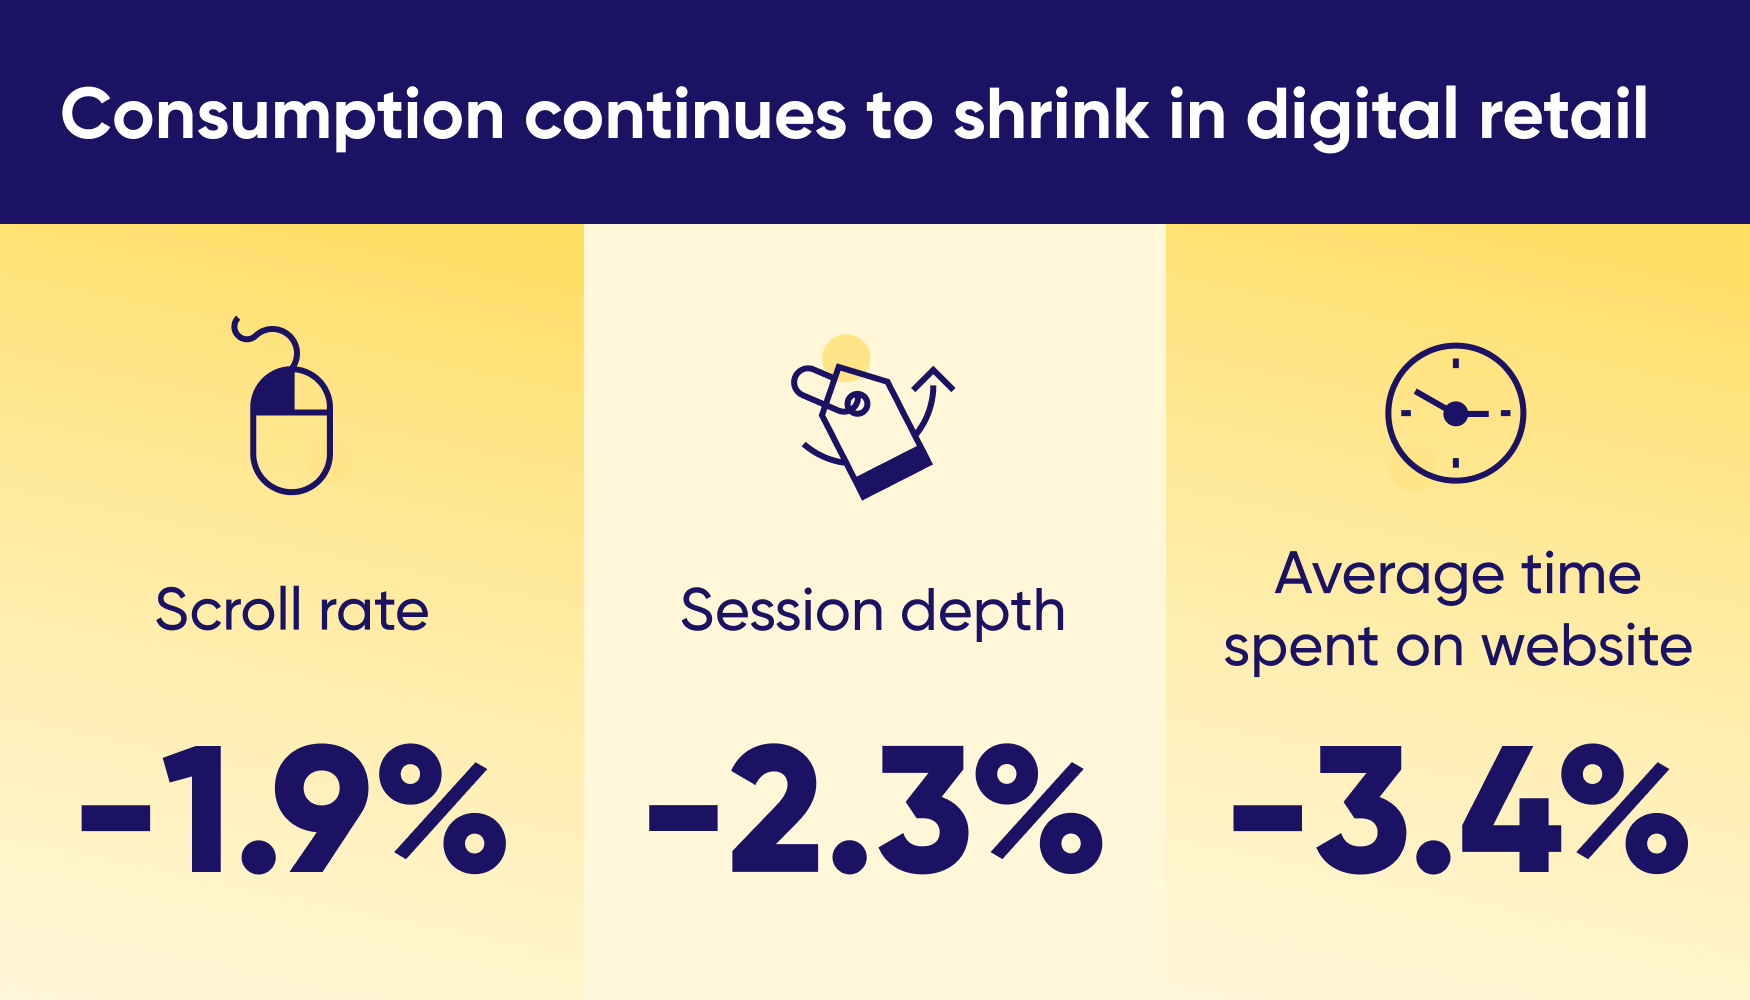
Another crucial factor behind falling conversion rates was an across the board decline in content consumption metrics. Session depth fell another -2.3%. Scroll rate declined from 47.8% to 46.9%. And time spent on websites fell by -3.4%.
The average page views per buying session (that is, a session that ended in a purchase) in 2023 stretched beyond 20 pages, showing that the more pages and content site visitors consume the more likely they are to convert.
And when you compare that to the average page views per session in 2023 (6.1 on desktop and 4.8 on mobile), it’s easy to see that the decline of content consumption is having a huge impact on conversion rates.
Our report offers various insights into tackling the growing consumption crisis, including highlighting the device type each vertical should prioritize for optimization.
But even before reading our report, the next two insights will help point you in the right direction to start raising your consumption and conversion rates.
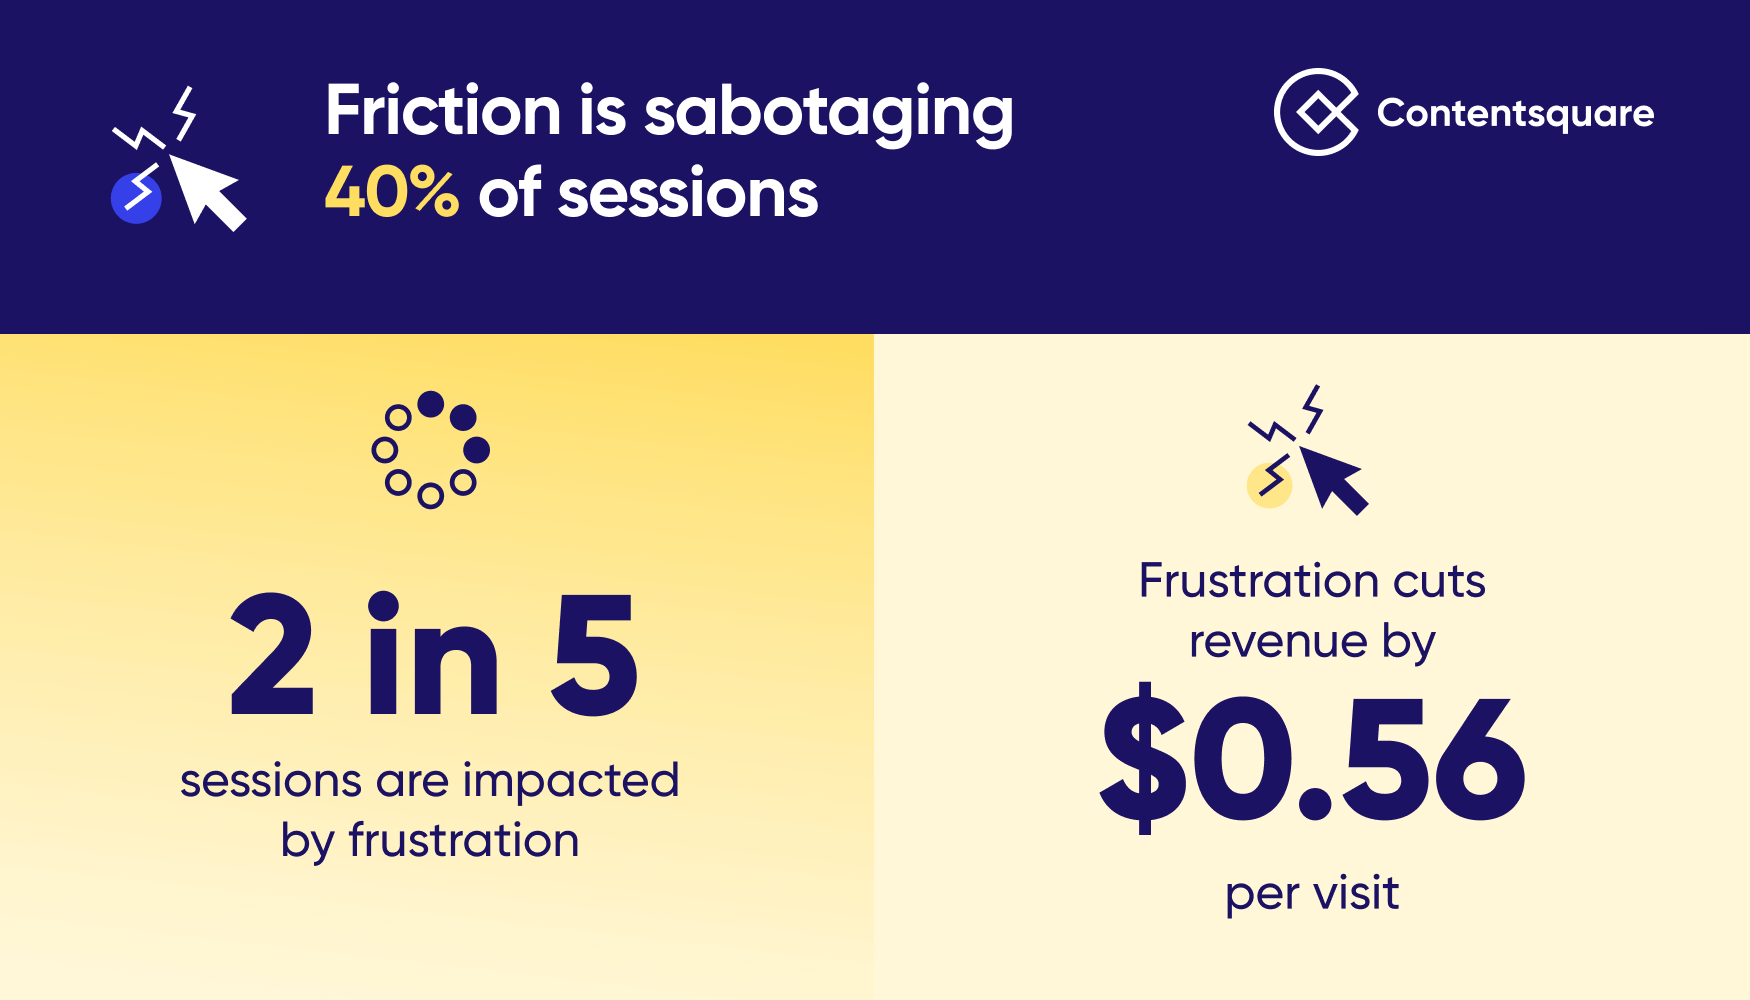
First up, you need to know your biggest enemy: User frustration, which our report reveals affects 40% of shopper experiences. This frustration is caused by many factors, including website errors and user experience design flaws, with JavaScript errors being this year’s most common (and damaging) cause, impacting 19.1% of sessions
With two out of every five visits impacted by frustration, these factors directly impact retail conversion rates and cost retailers $0.56 per visit in wasted spend.
Google is now endorsing (and demanding) the elimination of frustration from the experience. Their Core Web Vitals (CWVs) provide an objective set of performance standards for sites: perform poorly and you’re wasting precious visits.
There’s money to be recouped by fixing frustration. You can start by reading our report. We list the main CWSs where retailers are falling short and seeing far shallower session depths, a higher bounce rate, and limited engagement.

See how your digital experience stacks up.
Download the 2024 Retail Digital Experience Benchmark Report for the metrics that really matter.
In 2023, new traffic continued to make up the majority (52.1%) of visits to retail sites. (You’ll find the full breakdown of new vs. returning traffic share, by retail vertical, year-over-year, in our report.)
And if retailers want to improve their conversion rates in 2024, they might want to change that.
Because when customers come back, they don’t just browse—they buy, and in a big way. Our report reveals that sites with higher numbers of returning visitors enjoy a staggering +40% higher conversion rate.
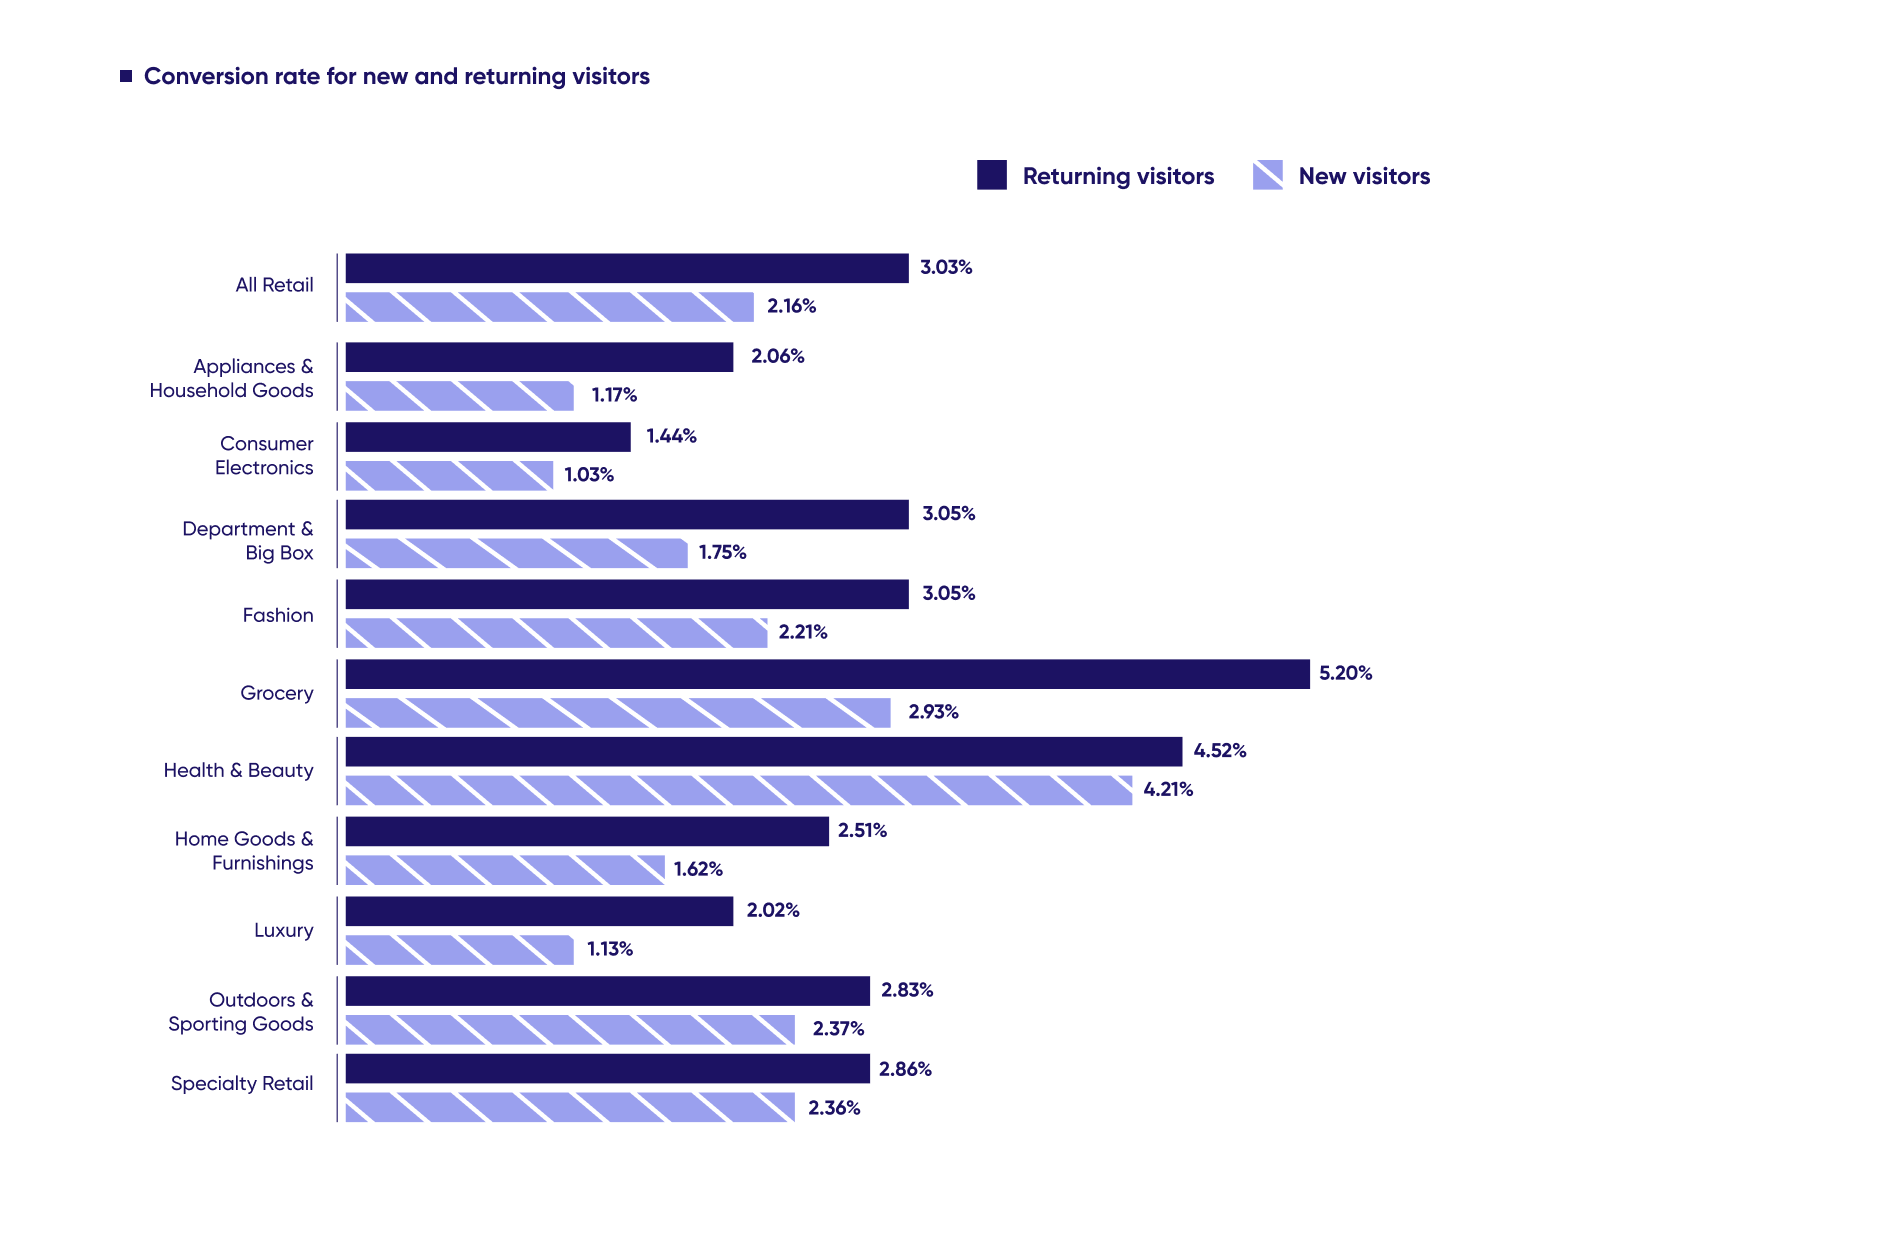
Coupled with the fact that, unlike returning visitors, newcomers are more likely to come from paid channels, it means that those repeat engagements aren’t just valuable—they’re also cheaper to attract and convert 4x better than new visitors.
This strategic revelation is key for any retailer looking to maximize value and efficiency in one fell swoop. Tap into owned marketing—like email and SMS—to attract more returning traffic and boost revenue.
So if you want a mantra for driving conversions and growth in 2024 through your digital customer experience, here it is: “Engage, convert, retain—and repeat!”
We’ve just scratched the surface of the insights on offer in the 2024 Retail Digital Experience Benchmark Report. Here we’ve had room to give you a quick oversight of the lay of the land in retail in 2023—and of what you need to work on in 2024 to see healthy conversion rates and growth.
As for the ‘how’ of making these changes, you’ll need technology that enables you to explore and optimize every stage of the customer journey. That’s where digital experience analytics (DXA) comes into play.
DXA goes beyond traditional analytics by enabling you to dig into the full range of user behavior, recording and analyzing the entire customer journey, including both the clicks and the conversion-driving activity that happens between the clicks: scrolls, hovers, taps, etc.
We’ve written elsewhere about how DXA enables you to optimize conversion rates—and we’ve seen countless of our retail clients use Contentsquare to do exactly that.
French luxury fashion house Kenzo, for example, saw a +150% increase in online conversion rate (a +25% increase from the previous year) within seven days of making changes to its eCommerce site suggested by Contentsquare.
If you’re thinking you might like to join the ranks of retailers who’ve used Contentsquare to supercharge conversions, why not check out a short product tour to see it in action?
You never know, it could be a conversion experience for you—and, ultimately, for your customers.

Take a product tour
Get to grips with Contentsquare fundamentals with this 6 minute product tour.