Uncover trends for crucial digital KPIs
Access the 2024 Digital Experience Benchmarks Report and Interactive Explorer.
Addressing this dissatisfaction is where conversion rate optimization (CRO) comes into play.
In this post, we’ll teach you the basics of CRO: From what a conversion is and how it’s calculated to what makes a good conversion rate, defined against industry benchmarks.
Conversion rate optimization (CRO) is the practice of increasing the percentage of people who take the desired action on your site. This conversion could be anything from making a purchase or adding an item to cart to signing up for a newsletter or filling out a form.
But a “conversion” doesn’t mean the same thing for everyone. Depending on your business and industry, conversion rate optimization means increasing the number of people making a purchase on your eCommerce site or boosting credit card application form fills on a banking site.
In simple terms, conversion rate is the rate at which conversions occur on a website, mobile site, or app.
The conversion rate is precisely the number of times visitors take the desired action on your site, divided by the total site traffic, the result of which is multiplied by 100 to create a percentage.
| CONVERSION RATE % | = | TOTAL GOAL COMPLETIONS | X | 100 |
| TOTAL WEBSITE VISITS |
This formula applies to various types of conversion, including eCommerce conversions (most often a purchase) and sign-up conversions (webinars, ebook downloads, etc).
Generally, a “good” conversion rate constitutes a percentage that is higher than the average. Averages can vary greatly from one industry to the next, and from one device to another.
We recently analyzed 46+ billion web sessions on 3,800+ global websites to determine average conversion rates for 14 different industries. From travel, B2B, and financial services to fashion, beauty, and luxury—we’ve analyzed it all.
Our data revealed that conversions have increased across all industries —jumping from 1.8% in 2020 to 2.3% in 2022. That’s a 28% increase! These rates differ across each industry, ranging from a low of 0.4% in the telecom industry to a high of 6.8% in both the pharmaceutical and grocery industries.
Uncover trends for crucial digital KPIs Access the 2024 Digital Experience Benchmarks Report and Interactive Explorer.
| Category | Avg. Conversion Rate |
| Automotive | 0.7% |
| B2B | 0.6% |
| Consumer Electronics | 1.4% |
| Energy | 0.1% |
| Fashion | 3.3% |
| Financial Services | 0.2% |
| Grocery | 6.8% |
| Health & Beauty | 3.9% |
| Home Goods & Furnishings | 2.8% |
| Luxury | 1.1% |
| Media | 0.4% |
| Pharmaceuticals | 6.8% |
| Telecoms | 0.5% |
| Travel & Hospitality | 3.9% |
Overall, mobile conversion rates still have a way to go to catch up with desktop averages, highlighting the need for a stronger CRO strategy for mobile.
| Device | Avg. Conversion Rate |
| Desktop | 3.0% |
| Mobile | 1.6% |
If you’re in a sector where the majority of your conversions come from desktop, try offering your mobile users the option to complete their purchase on desktop (such as allowing them to save items to their account basket on mobile to finish on desktop).
Users love to browse quickly on mobile devices but could be put off by having to fill in more complicated delivery and payment information. Giving them the option to switch will help increase your conversion rate and customer satisfaction (and retention!).
Although some of these rates may seem unfeasible, especially to those who are new to CRO, it is healthy to aim higher, and with the tools available to digital marketing teams today (analytics platforms, personalization engines, etc) the sky is the limit.
There is no one size fits all solution to optimizing your website conversions, because it really depends on your industry and your customers. However, there are multiple tips and tricks that you can follow in order to optimize your conversion rate. Check out a few of our faves:
You might have the most attractive offer on the market and the most fascinating content, but your efforts won’t go far unless the user experience matches the expectations of your visitors.
That’s why removing friction in your experience is key to improving conversions. Why not try the following:
Your customers are impatient and want answers immediately!
So naturally, your site’s performance can have a massive impact on conversions. If your website is slow to load and isn’t user-friendly or responsive, chances are your users are going to bounce.
And it’s a well-known fact that load times can heavily impact conversions. Google indicates that visitors are 32% more likely to leave a site if the page takes between 1 and 3 seconds to load.
To stop that from happening, you need to understand how your website’s performing by running your URL through a site speed testing tool and then, optimizing your Core Web Vitals accordingly.
Benchmark your site performance Get data based on over 2,000 websites measuring 4 site loading KPI’s to optimize your site performance.
You’ve put a lot of thought into your CTAs, your online content, and your UX. Now what?
Well CRO doesn’t stop there. It’s a continuous process. You have to analyze your traffic, bounce rate, click rate, session duration, conversions, and exits at each stage of the funnel to identify any unanticipated obstacles to conversion.
When armed with insights, you can now test what works to improve conversions on your site and what doesn’t, modifying the copy, images, or repositioning CTAs and navigation menus to see how this impacts conversions.
Tips and tricks are great, but seeing how other businesses in your sector are successfully optimizing their conversion rate can help you emulate similar successes on your own site. To give you some real-life examples here are three CRO hero stories:
The Beerwulf team noticed a high percentage of mobile visitors were landing on a product page and bouncing.
The team realized that critical information like price, product info, and the purchase CTA were hidden below the fold on mobile and Contentsquare data revealed 40% of users weren’t scrolling down the page to learn more. Ultimately, the team moved the item name and price above the product image to help increase conversions and decrease bounce rate.
Using customer journey analysis, the Beerwulf product team also noticed customers were repeatedly navigating between their product listing page and product detail pages to compare the contents of their mixed beer packages.
The team then introduced new functionality that enabled customers to view package details directly from the product listing page, ultimately resulting in a 2.4% increase in conversion rate.
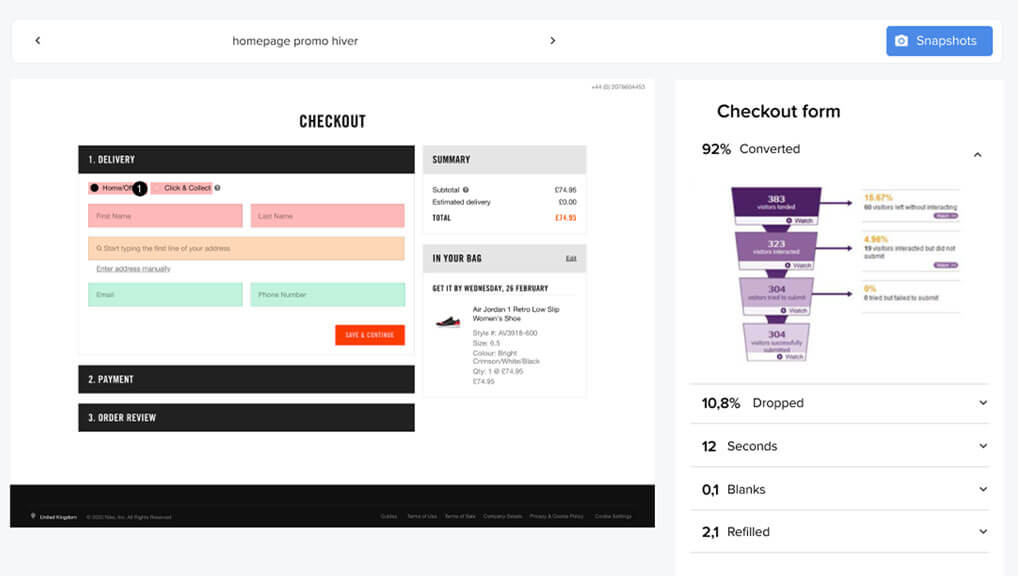
The RingCentral website consistently has a high level of traffic, but visitors did not always convert, and potential customers were dropping off. They needed to understand how customers interacted with their website, to ensure elements of the website were aligned with customer behavior to drive interaction and engagement.
The team had already been conducting A/B testing, but didn’t have experience-related metrics and were unable to consider the website from the point of view of a customer to recognize where the website wasn’t providing an optimum experience.
Using the Contentsquare platform enabled RingCentral to gain a deeper understanding of the entire customer experience — establishing which areas needed to be removed or redesigned, what customers were clicking on or searching for, and what aspects were reducing the probability to convert.
This helped the RingCentral team identify several areas that were ripe for testing and improvement. One such test to the main lead capture form resulted in an immediate 25% increase in conversion rate.
Conversion rate can be determined from two types of visitor journeys to a site, or their arrival at it.
1. Organic keyword search visits and paid search visits
The first category falls upon both organic keyword search visits and paid search visits (ads), while the second category of site entries stems from URL visits, also known as direct visits to your website.
Moulded by the user experience, these subsequent journeys are invaluable for optimizing conversion rates. Those who click on a landing page from a keyword search or social media ad already possess some interest in your offering, since they not only looked up the keyword — or engaged with the ad — but entered your website through the associated link.
Besides social posts and ads, queries on search engines also lead users to landing pages. These are reached in the links below a website’s general search result — typically the homepage — in the Search Engine Results Page (SERP). They usually lead to specific products or pages, reflecting the query.
2. URL-based, or direct visits to a site page
The other type of customer journey is derived from a URL-based, or direct visit to a site page. With URL-based visits to your site, the intent is less clear; some visitors may arrive at it for informational purposes while others may have a clearer objective. Even so, those who visit for the information may not be interested to sign up for your whitepaper, case study, email list or other content.
Obstacles and frustrations in the digital journey will impel your visitors to bounce from – or exit – your site. At worst, the visitors will head to your competitors’ sites. Thus, the experience a visitor has on your site and the way in which it helps them achieve their goal(s) are exceptionally important and must be calibrated to ensure good conversions.
Patience may be a virtue, but who actually has the time for it when you operate a business or work in marketing?
In website development
Since conversions are closely tied to revenue, the first time to think about optimization should come rather early on in your website development.
If it is your first iteration in establishing a website, there are general cautions you should take, such as assuring all site elements are operational, especially the ones that lead to a conversion. So make sure all on-site CTAs, links, form fields and the like work without any trouble.
For example, your business will inevitably lose revenue if the same link remains broken for even a moderate period of time, or during any UX mishap, like the checkout button being buried beneath the fold.
During a site redesign
If you are in the redesign phase of your site, then you should learn from the old or current user experience of your website. Take into account what hasn’t yielded satisfactory results from analyzing your consumers’ behaviors on your previous site.
In SEO & SEM
You should start strategizing for CRO, as the aforesaid conversion rates from organic keyword searches and paid searches already have their own separate sub-discipline for optimizations. They are what is known as search engine optimization or SEO, and SEM, or search engine marketing. The former deals with optimizing organic search clicks, while the latter deals with optimizing paid searches.
Conversion rate optimization primarily deals with optimizing the customer experiences to improve conversions since search-based conversions have their own optimization best practices (SEO and SEM).
Either way, you need to improve visitor journeys so consumers can fulfil their digital goals painlessly.
Monitoring your visitors’ digital happiness is key to keeping your customers engaged and your conversion rate healthy. Improving your user experience will result in longer site journeys, fewer bounces and more positive sentiment, which is inextricably tied to your brand.
If visitors have a poor experience on your site, they’re likely to leave, regardless of how good your product is. Optimizing your website begins with analyzing your users’ behaviors. It’s the only way to ensure a customer-centric CRO strategy based on behavioral evidence, rather than intuition.
Take a product tour Get to grips with Contentsquare fundamentals with this 6 minute product tour.
Analytics today can keep you abreast of any behavioral anomalies and deviations on your site so that you can improve the experience quickly and continuously. Only after you’ve analyzed how users interact with your site — what is effective and what isn’t — can you make results-yielding decisions for CRO.